how do we decide what chart to use?
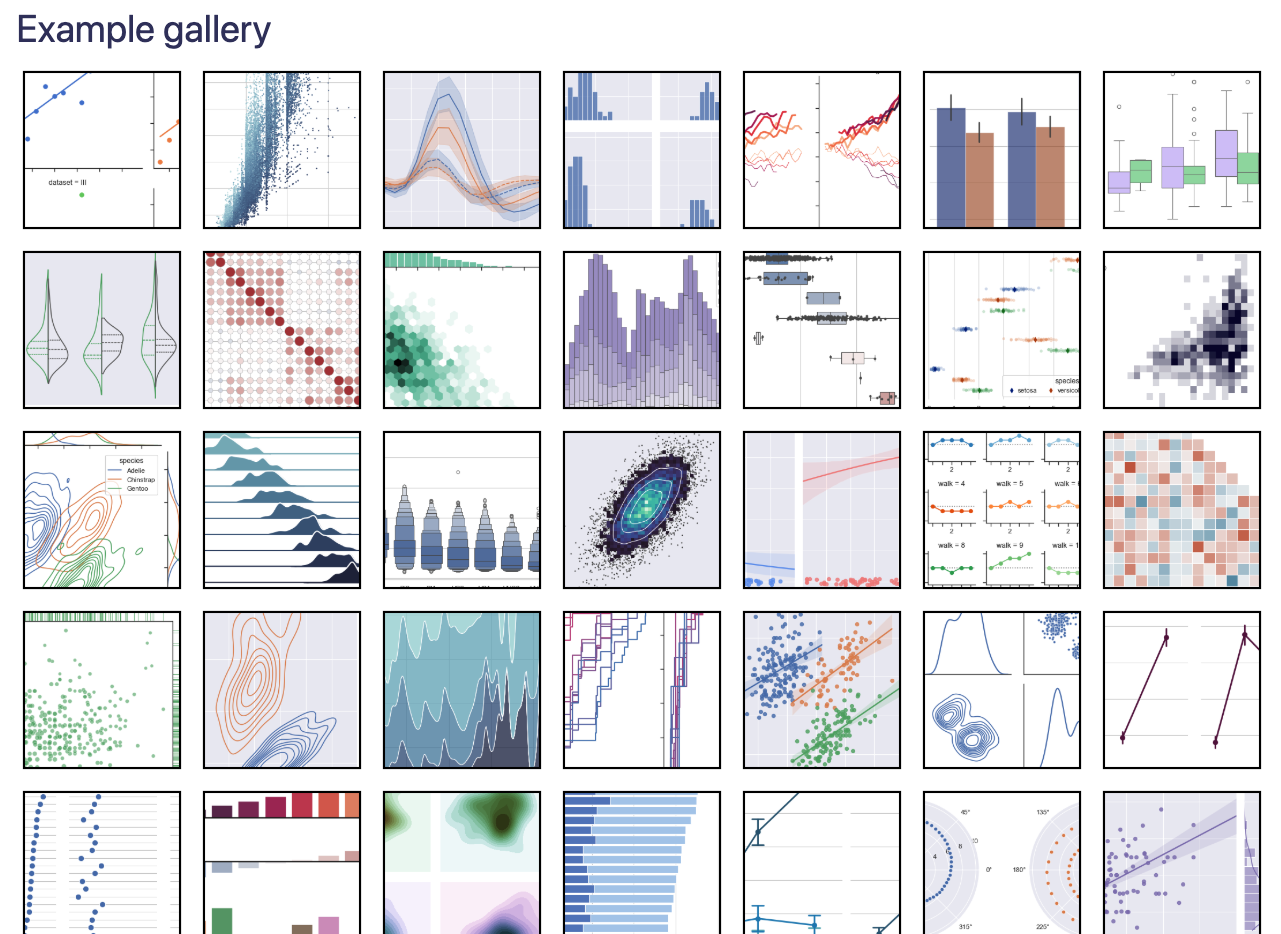
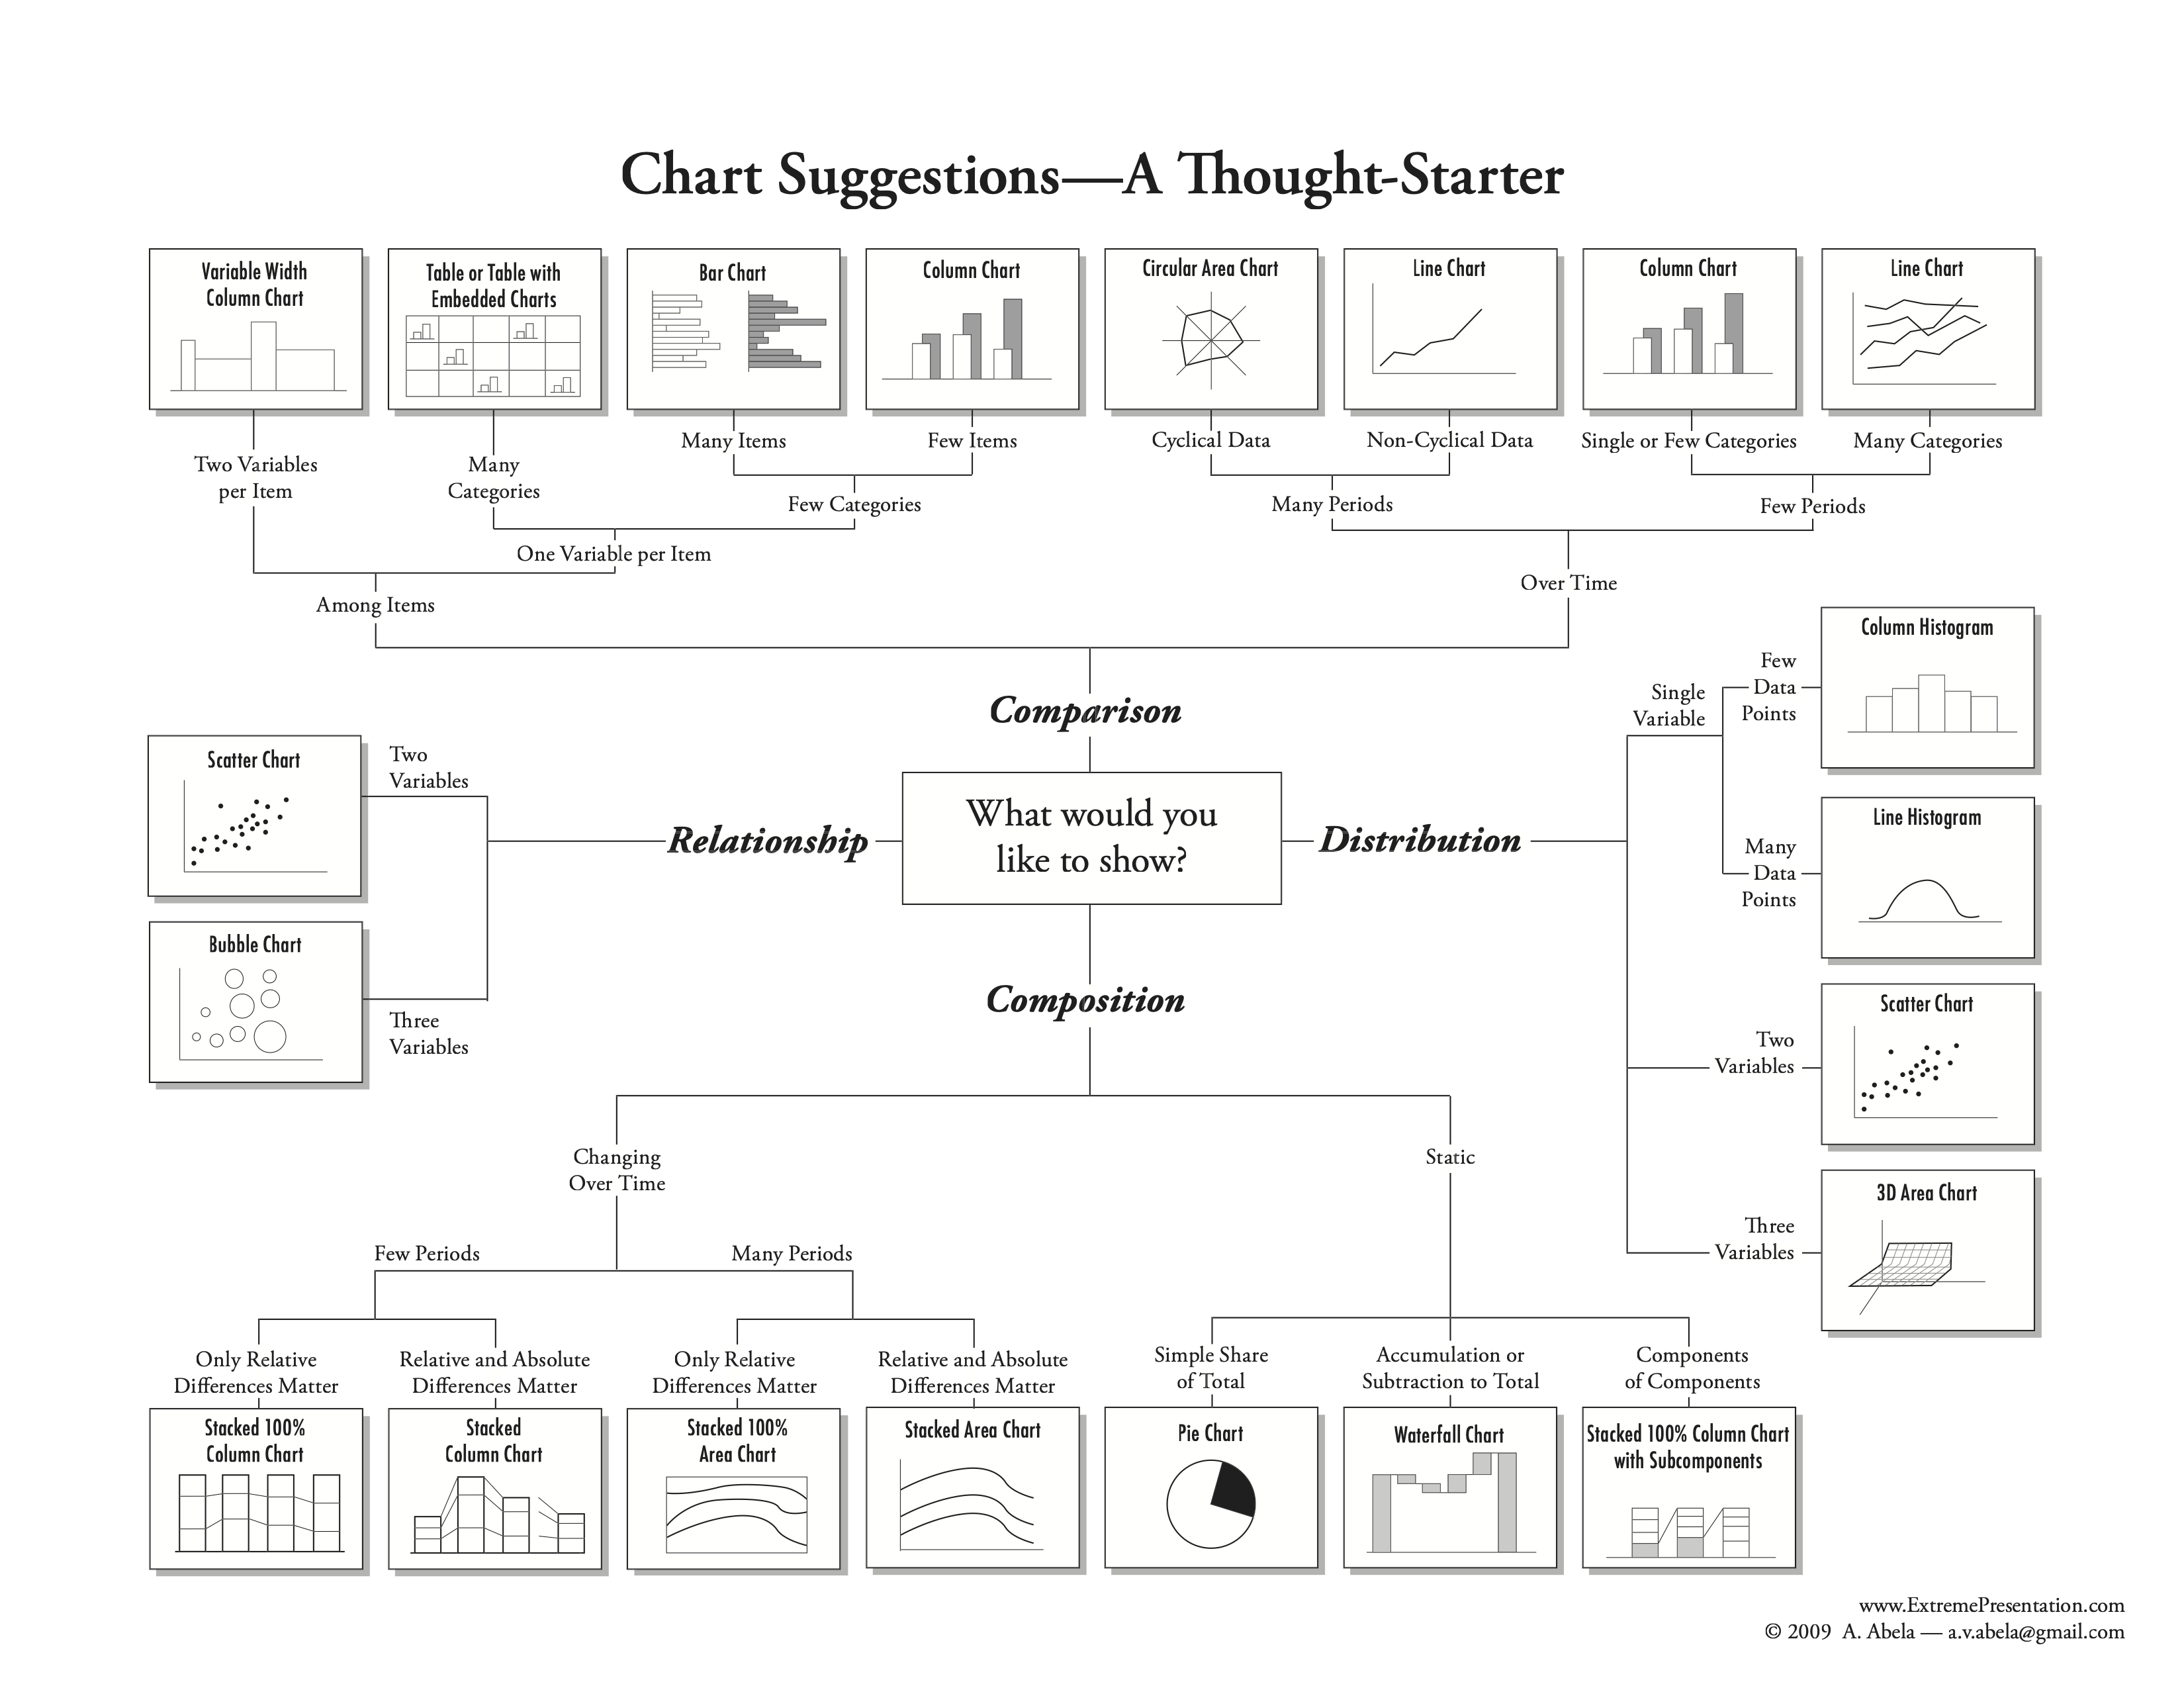
graphics don't always fall into neat taxonomies
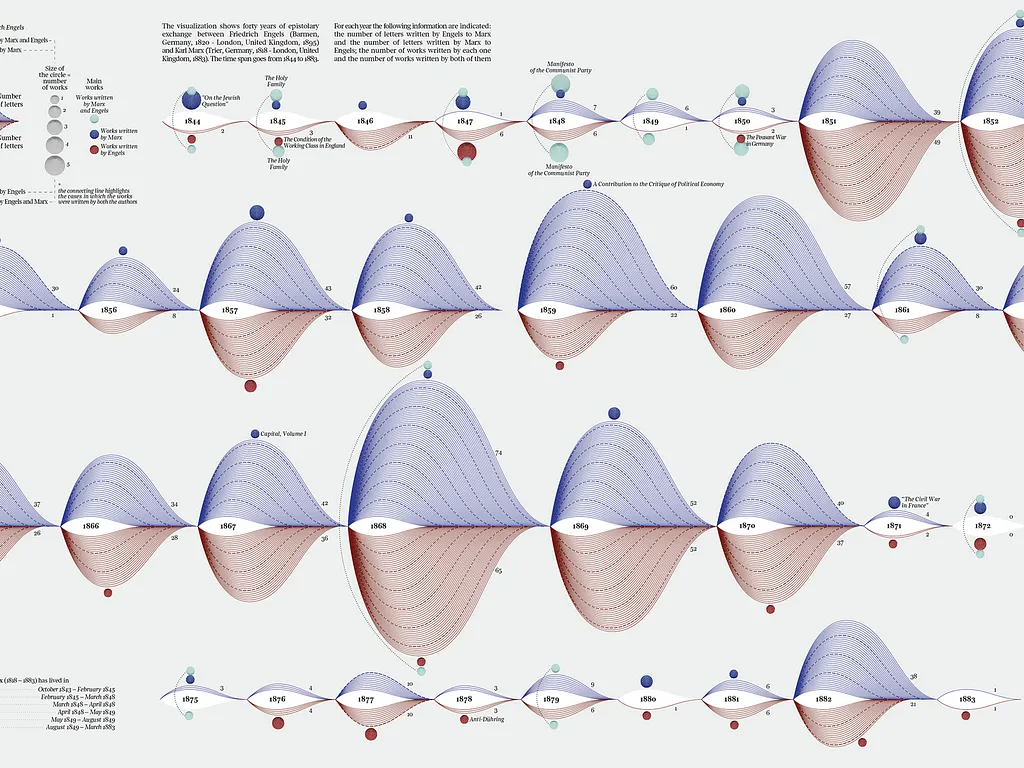
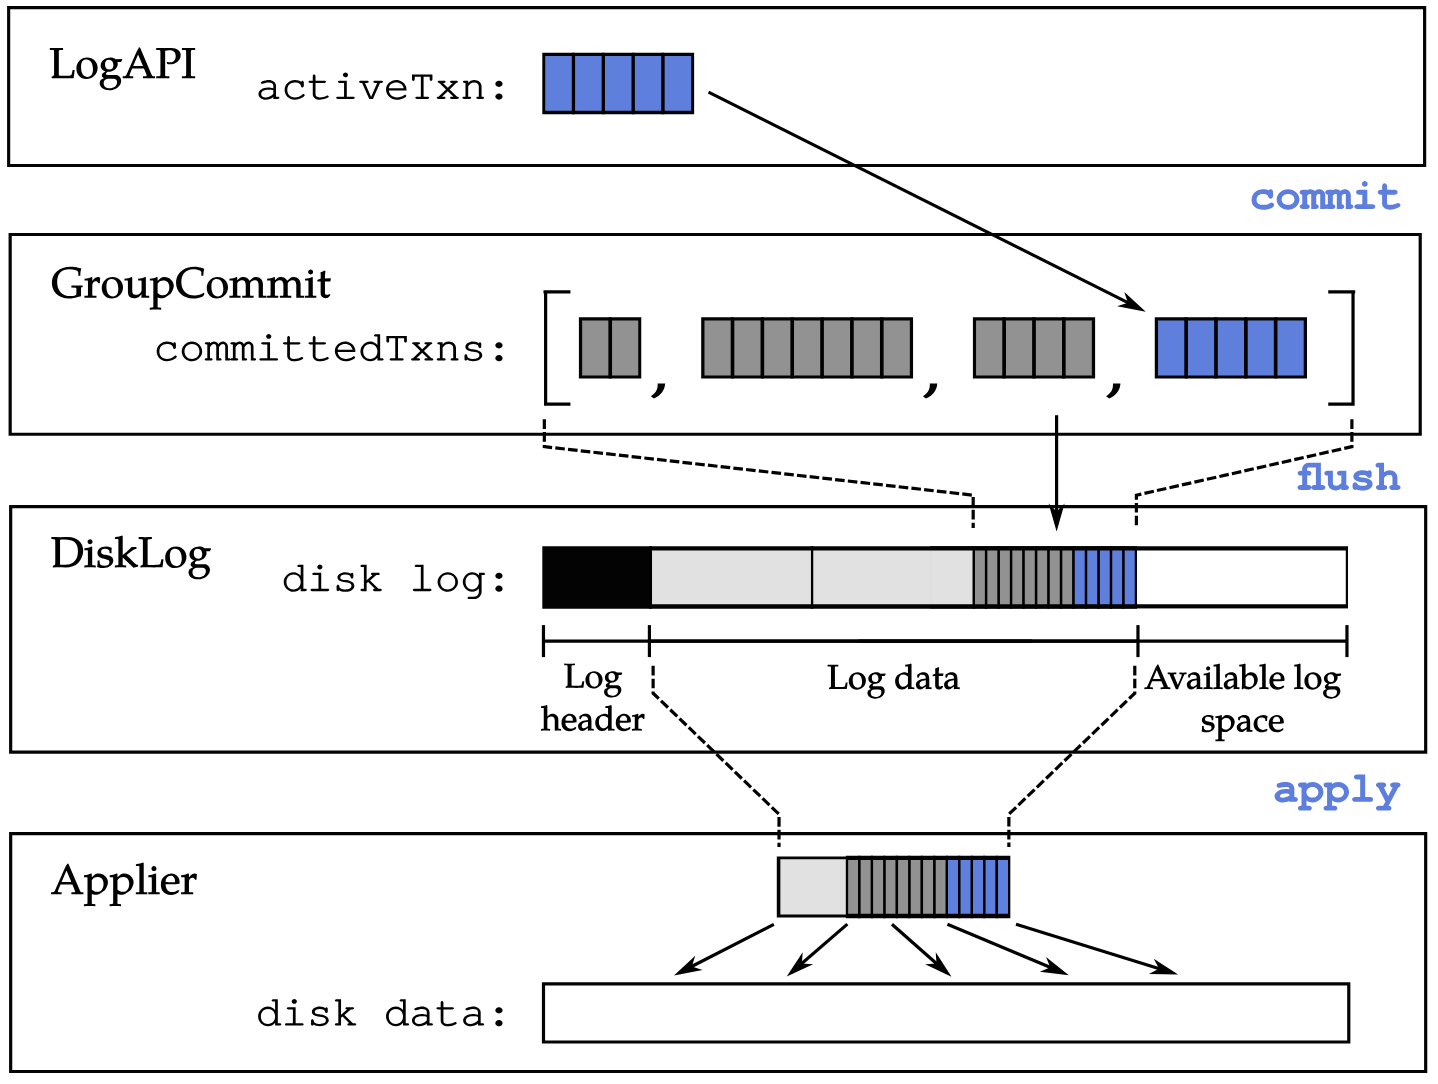
grouped bar charts aren't created equal
what trend do you see here?
what about now?
how about now?
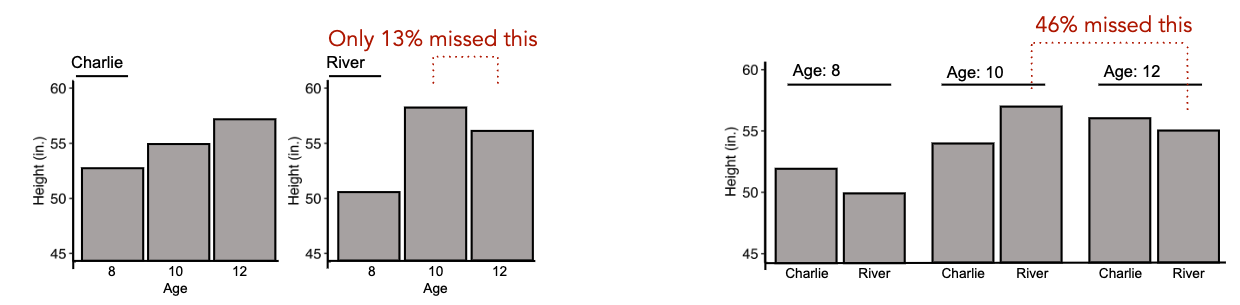
these are all the same kind of chart — yet our takeaways differ
To talk about visual structure precisely, we need a language.
GoFish is based on Gestalt grouping principles
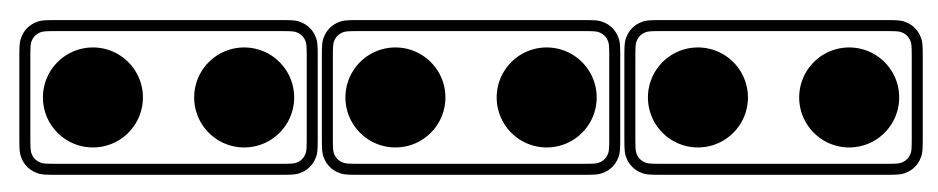
| containment |
|
| connection |

|
| similar attribute |

|
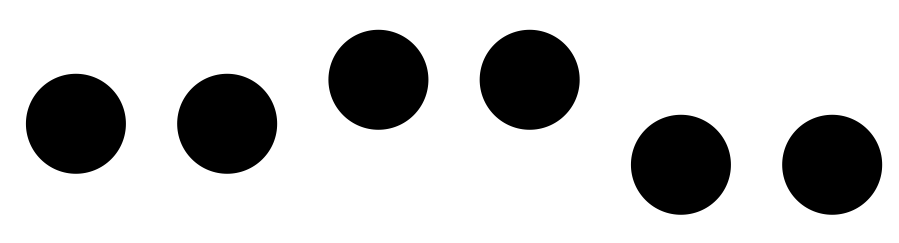
| alignment |
|
| proximity / uniform density |

|
| containment |
|
| connection |
|
| similar attribute |
|
| alignment |
|
| proximity / uniform density |
|
our first GoFish spec
our first GoFish spec
our first GoFish spec
part-to-whole relationships
stack()
chart(data).flow(
    spread("lake",    dir="x"),
).mark(
    rect(h="count")
)
chart(data).flow(
spread("lake", dir="x"),
stack("species", dir="y"),
).mark(
rect(
h="count",
fill="species",
)
)chart(data).flow( # operators can be chained!
spread("lake", dir="x"),
stack("species", dir="y"),
).mark(
rect(
h="count",
fill="species",
)
)Queries:
- greatest/least lake total
- pairwise lake comparisons
- part-to-whole species comparisons (e.g., what % of Lake A is Bass?)
- pairwise comparisons of the same species across lakes
nesting order matters
chart(data).flow(
  spread("lake",    dir="x"),
  stack("species",  dir="y"),
).mark(rect(h="count", fill="species"))chart(data).flow(
spread("lake", dir="x"),
spread("species", dir="x"),
).mark(rect(h="count", fill="species"))chart(data).flow(
spread("species", dir="x"),
spread("lake", dir="x"),
).mark(rect(h="count", fill="species"))flattening the hierarchy
chart(data).flow(
  spread("lake",    dir="x"),
  stack("species",  dir="y"),
).mark(rect(h="count", fill="species"))chart(data).flow(
table("lake", "species"),
).mark(rect(fill="count"))sorting keys
derive() to sort
chart(data).flow(
    spread("lake",   dir="x"),
    derive(lambda d: sorted(d, key="count")),
    stack("species", dir="y"),
).mark(
    rect(h="count", fill="species")
)
Queries:
- greatest/least lake total
- pairwise lake comparisons
- greatest/least species total within lake
- part-to-whole species comparisons (e.g., what % of Lake A is Bass?)
- pairwise comparisons of the same species across lakes
connect across groups
connect the stacks into a continuous ribbon
chart(data).flow(
    spread("lake",   dir="x"),
    derive(lambda d: sorted(d, key="count")),
    stack("species", dir="y"),
).mark(
    rect(h="count", fill="species")
)
chart(data).flow(
spread("lake", dir="x", spacing=64),
derive(lambda d: sorted(d, key="count")),
stack("species", dir="y"),
).mark(
rect(h="count", fill="species")
)Layer([
chart(data).flow(
    spread("lake", dir="x", spacing=64),
    derive(lambda d: sorted(d, key="count")),
    stack("species", dir="y"),
).mark(
    rect(h="count", fill="species")
),
])Layer([
chart(data).flow(
spread("lake", dir="x", spacing=64),
derive(lambda d: sorted(d, key="count")),
stack("species", dir="y"),
).mark(
rect(h="count", fill="species").name("bars")
),
])Layer([
chart(data).flow(
spread("lake", dir="x", spacing=64),
derive(lambda d: sorted(d, key="count")),
stack("species", dir="y"),
).mark(
rect(h="count", fill="species").name("bars")
),
chart(???).flow(???).mark(???),
])Layer([
chart(data).flow(
spread("lake", dir="x", spacing=64),
derive(lambda d: sorted(d, key="count")),
stack("species", dir="y"),
).mark(
rect(h="count", fill="species").name("bars")
),
chart(select("bars")).flow(???).mark(???),
])Layer([
chart(data).flow(
spread("lake", dir="x", spacing=64),
derive(lambda d: sorted(d, key="count")),
stack("species", dir="y"),
).mark(
rect(h="count", fill="species").name("bars")
),
chart(select("bars")).flow(group("species")).mark(???),
])Layer([
chart(data).flow(
spread("lake", dir="x", spacing=64),
derive(lambda d: sorted(d, key="count")),
stack("species", dir="y"),
).mark(
rect(h="count", fill="species").name("bars")
),
chart(select("bars"))
.flow(group("species"))
.mark(area(opacity=0.8)),
])[
{ lake: "Lake A", species: "Trout", count: 31, __ref: <GoFishMark> },
{ lake: "Lake A", species: "Bass", count: 23, __ref: <GoFishMark> },
...
]
steering attention with color
palette() for discrete colors
Layer([
  Chart(data, color=palette({
      "Salmon": "#e15759",
      "Trout":  "#4e79a7",
  })).flow(
    spread("lake", dir="x", spacing=64),
    derive(lambda d: sorted(d, key="count")),
    stack("species", dir="y"),
  ).mark(
    rect(h="count", fill="species").name("bars")
  ),
  chart(select("bars"))
    .flow(group("species"))
    .mark(area(opacity=0.6)),
])
Color can promote and demote queries very precisely.
Salmon and Trout read as the main story across lakes. Queries
about grayed-out species are de-emphasized. Some queries
become impossible!
wrap into polar coordinates
Layer({"coord": clock()}, [   # ← one change
  Chart(data, color=palette({
      "Salmon": "#e15759",
      "Trout":  "#4e79a7",
  })).flow(
    spread("lake", dir="x",
           spacing=2π/6, mode="center"),
    derive(lambda d: sorted(d, key="count")),
    stack("species", dir="y"),
  ).mark(
    rect(w=0.1, h="count", fill="species").name("bars")
  ),
  chart(select("bars"))
    .flow(group("species"))
    .mark(area(opacity=0.6)),
])
This use of polar space makes many queries very hard. Only a few queries are afforded, like Trout starting high, crossing, Salmon, and ending low. Vice versa for Salmon.
mapping length to angle changes the afforded queries
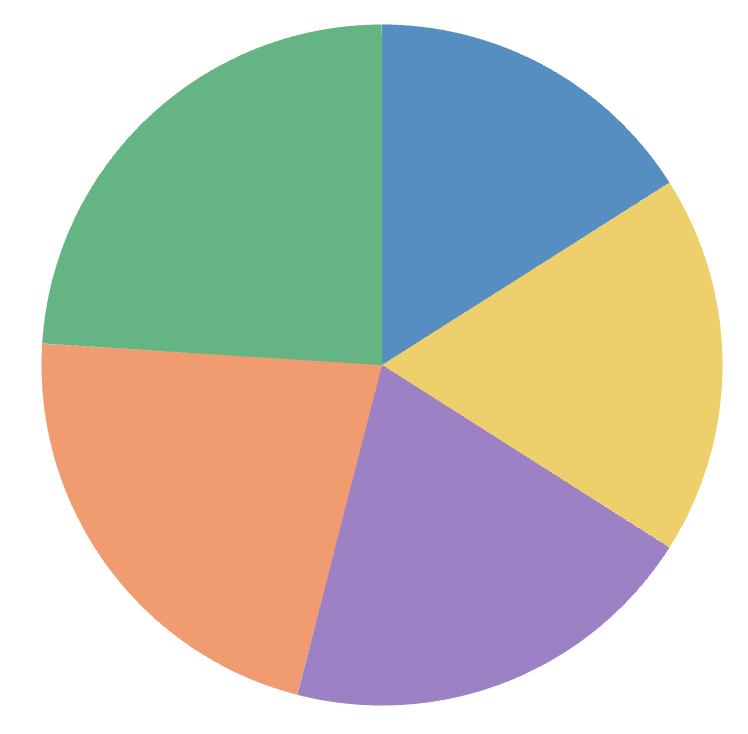
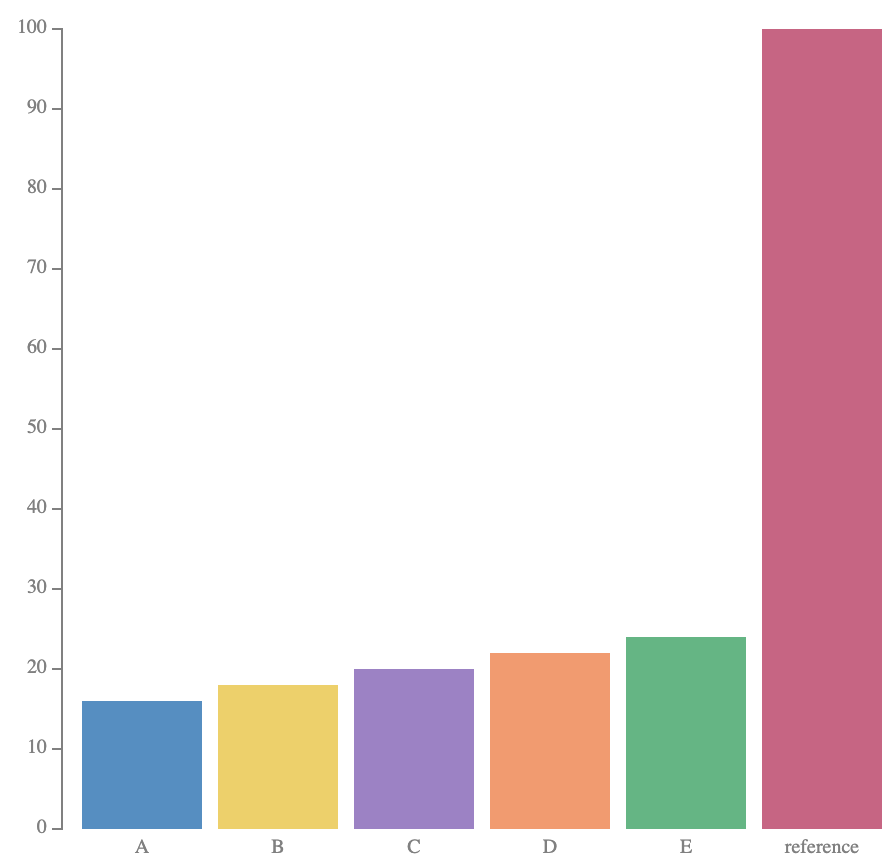
mapping length to angle changes the afforded queries
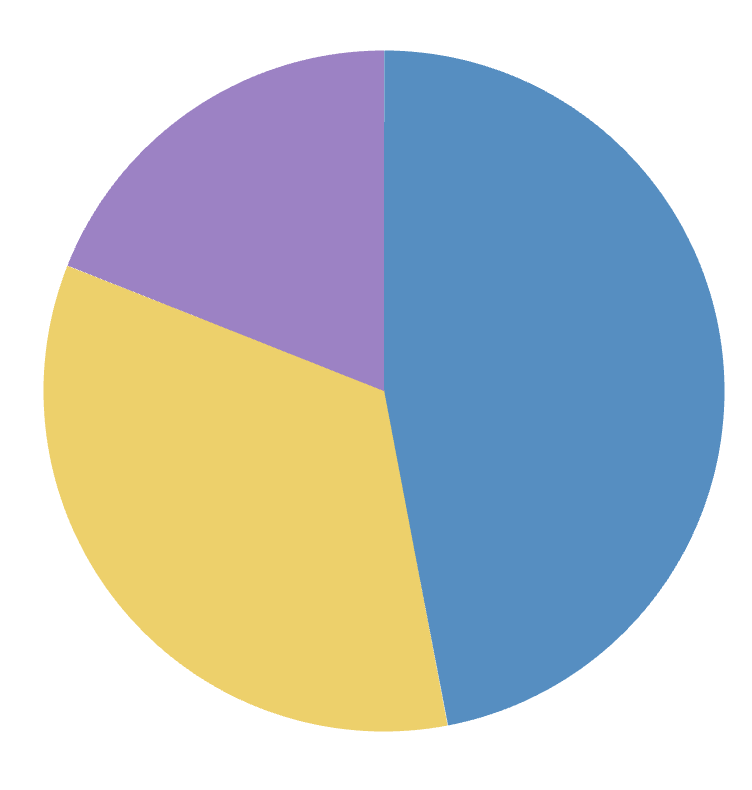
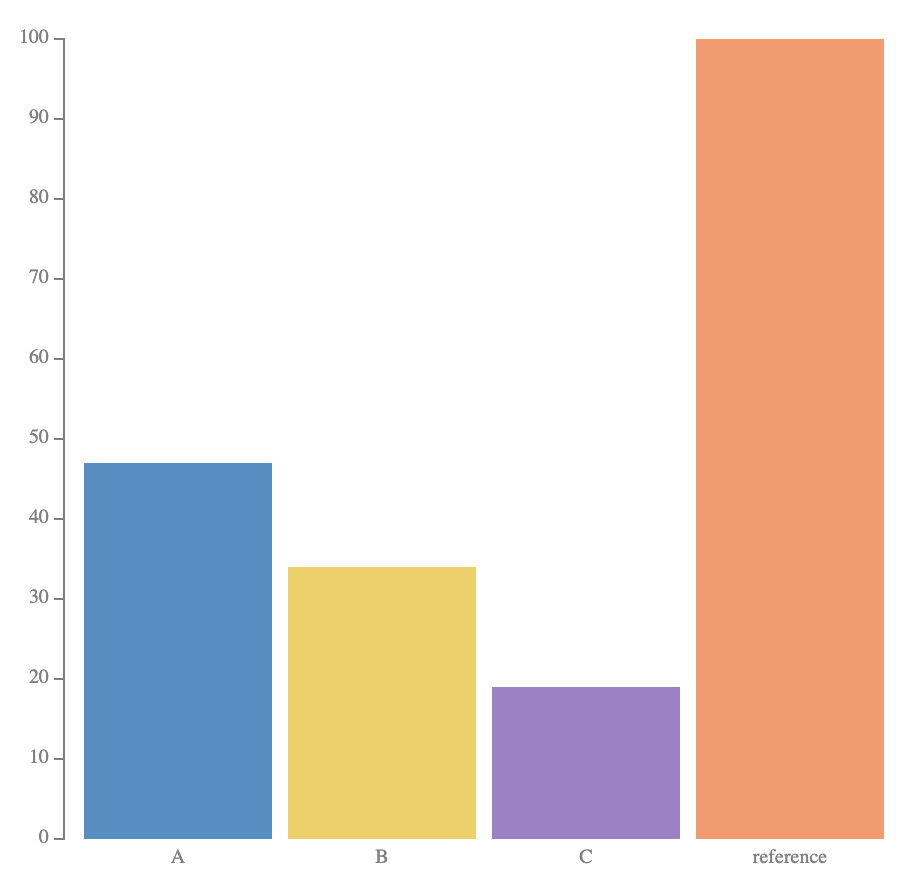
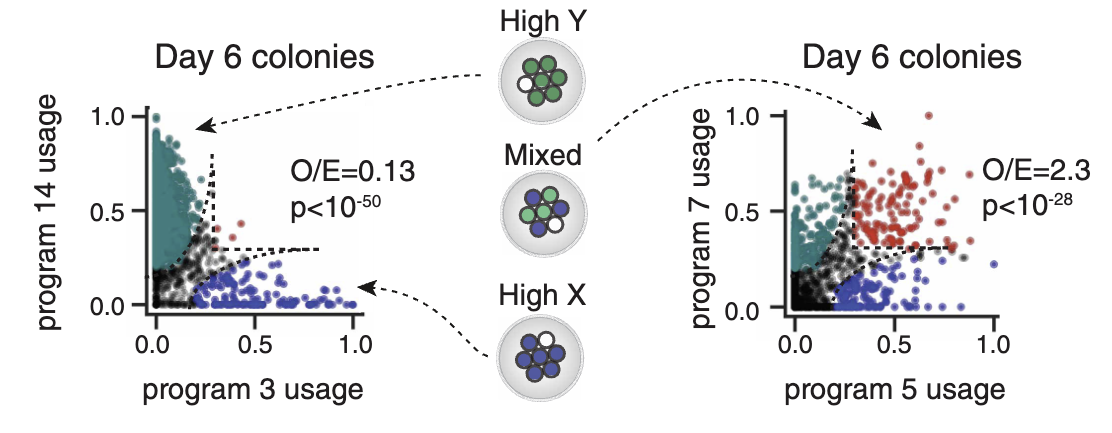
scatter -> pie = scatterpie
chart(scatter_data).flow(
    scatter("lake", x="x", y="y")
).mark(
    chart(coord=clock())
    .flow(stack("species", dir="x"))
    .mark(rect(w="count", fill="species"))
)
Outer structure:
scatter() affords "where?" queries.
Inner structure: pie affords "what fraction?" queries.
Swap the inner chart for a different part-to-whole viz
chart(scatter_data).flow(
    scatter("lake", x="x", y="y")
).mark(
    Flower(...)
)balloons???
chart(scatter_data).flow(
    scatter("lake", x="x", y="y")
).mark(
    Balloon(...)
)What just happened?
We took one dataset and made a series of deliberate structural moves.
Each move changed what was easy or hard to see.
We didn't have to pick from a menu of charts... though those are useful shorthands for common structures!
Instead, chart type labels like bar or pie were just structural motifs we encountered along the way.
operators map data types to Gestalt relations
| Operator | Data type | Gestalt relation |
|---|---|---|
spread |
discrete | alignment & uniform density |
stack |
partitioned continuous | part-to-whole |
scatter |
continuous × continuous | none — no discrete grouping |
area / line / ribbon
|
continuous or contiguous | connection |
table |
discrete × discrete | uniform density |
takeaways
1. Chart types are great shortcuts, but graphics are really sophisticated visual structures.
2. Changing this structure changes what your reader can and can't see in (probably) predictable ways.
3. Thinking structurally helps us move beyond familiar charts and rigid rules to designs that might better fit our data or task.
stay in the loop

GoFish updates & new features
(~weekly)
Sneak peeks from the book on
designing better graphics
(longer cycles)