GoFish: Graphical Structure in Plain Sight


you can one-shot a dashboard now
*Sped up 2–4×; actual time ~2.5 min. Placeholder: Arvind's VizChitra demo, to re-record with a scientific dataset.
…or even a scrollytelling narrative
*Actual time ~15 min. Placeholder: Arvind's VizChitra demo.
The catch
ok, but is it actually good?
How do you know the figure shows what your reader needs? How do you know what you want in the first place?
For a scientific figure, "impressive" isn't the bar. The bar is: does it support the comparisons your argument depends on?
The way out
we need to see structure, not chart types
To judge a figure, yours or the AI's, you need a way to see what it's doing.
Not "which chart type is this?" but "what does this arrangement let my reader see?"
how do we decide what chart to use?
how do we decide what chart to use?
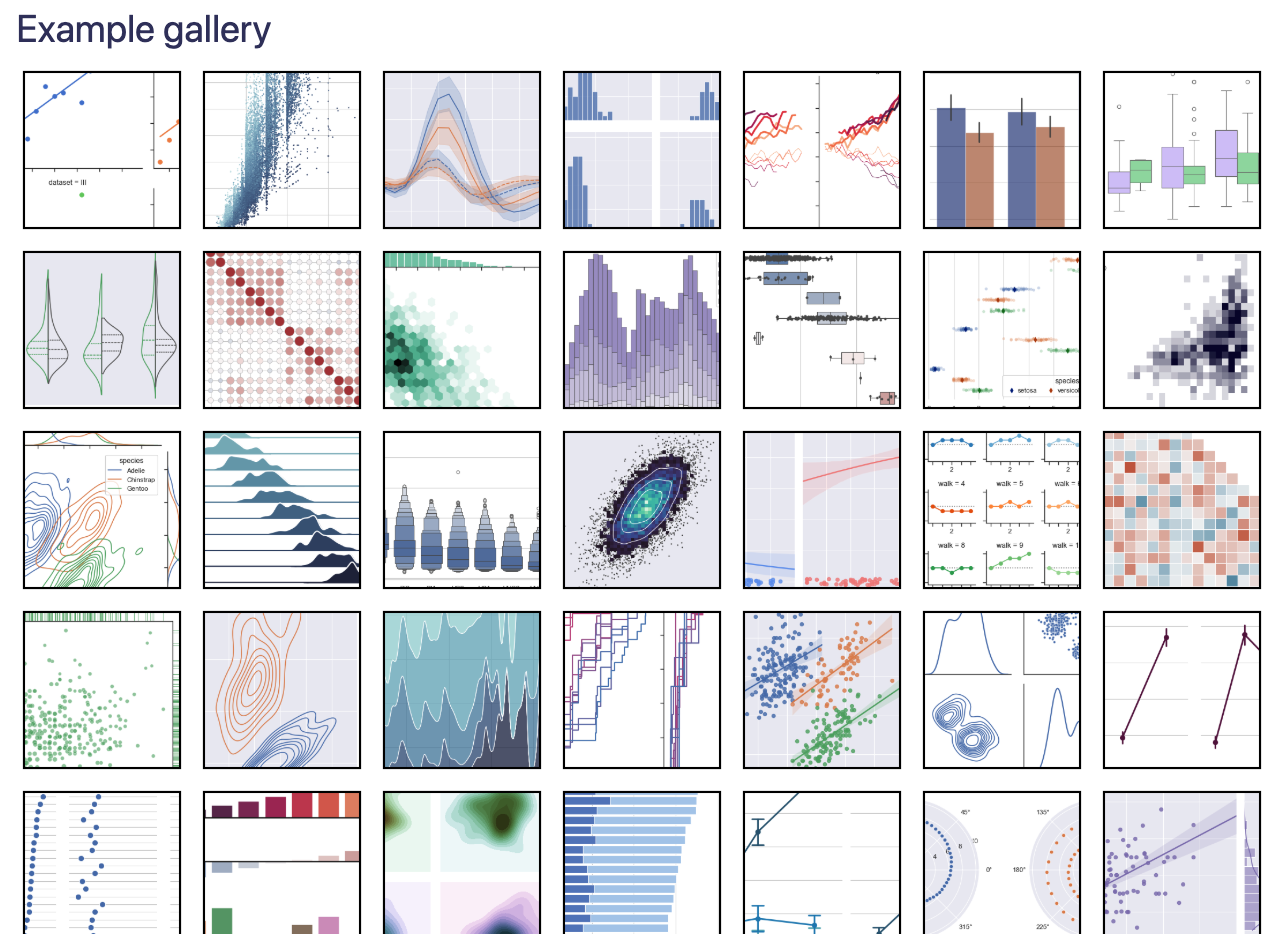
chart types lack underlying structure
how do we decide what chart to use?
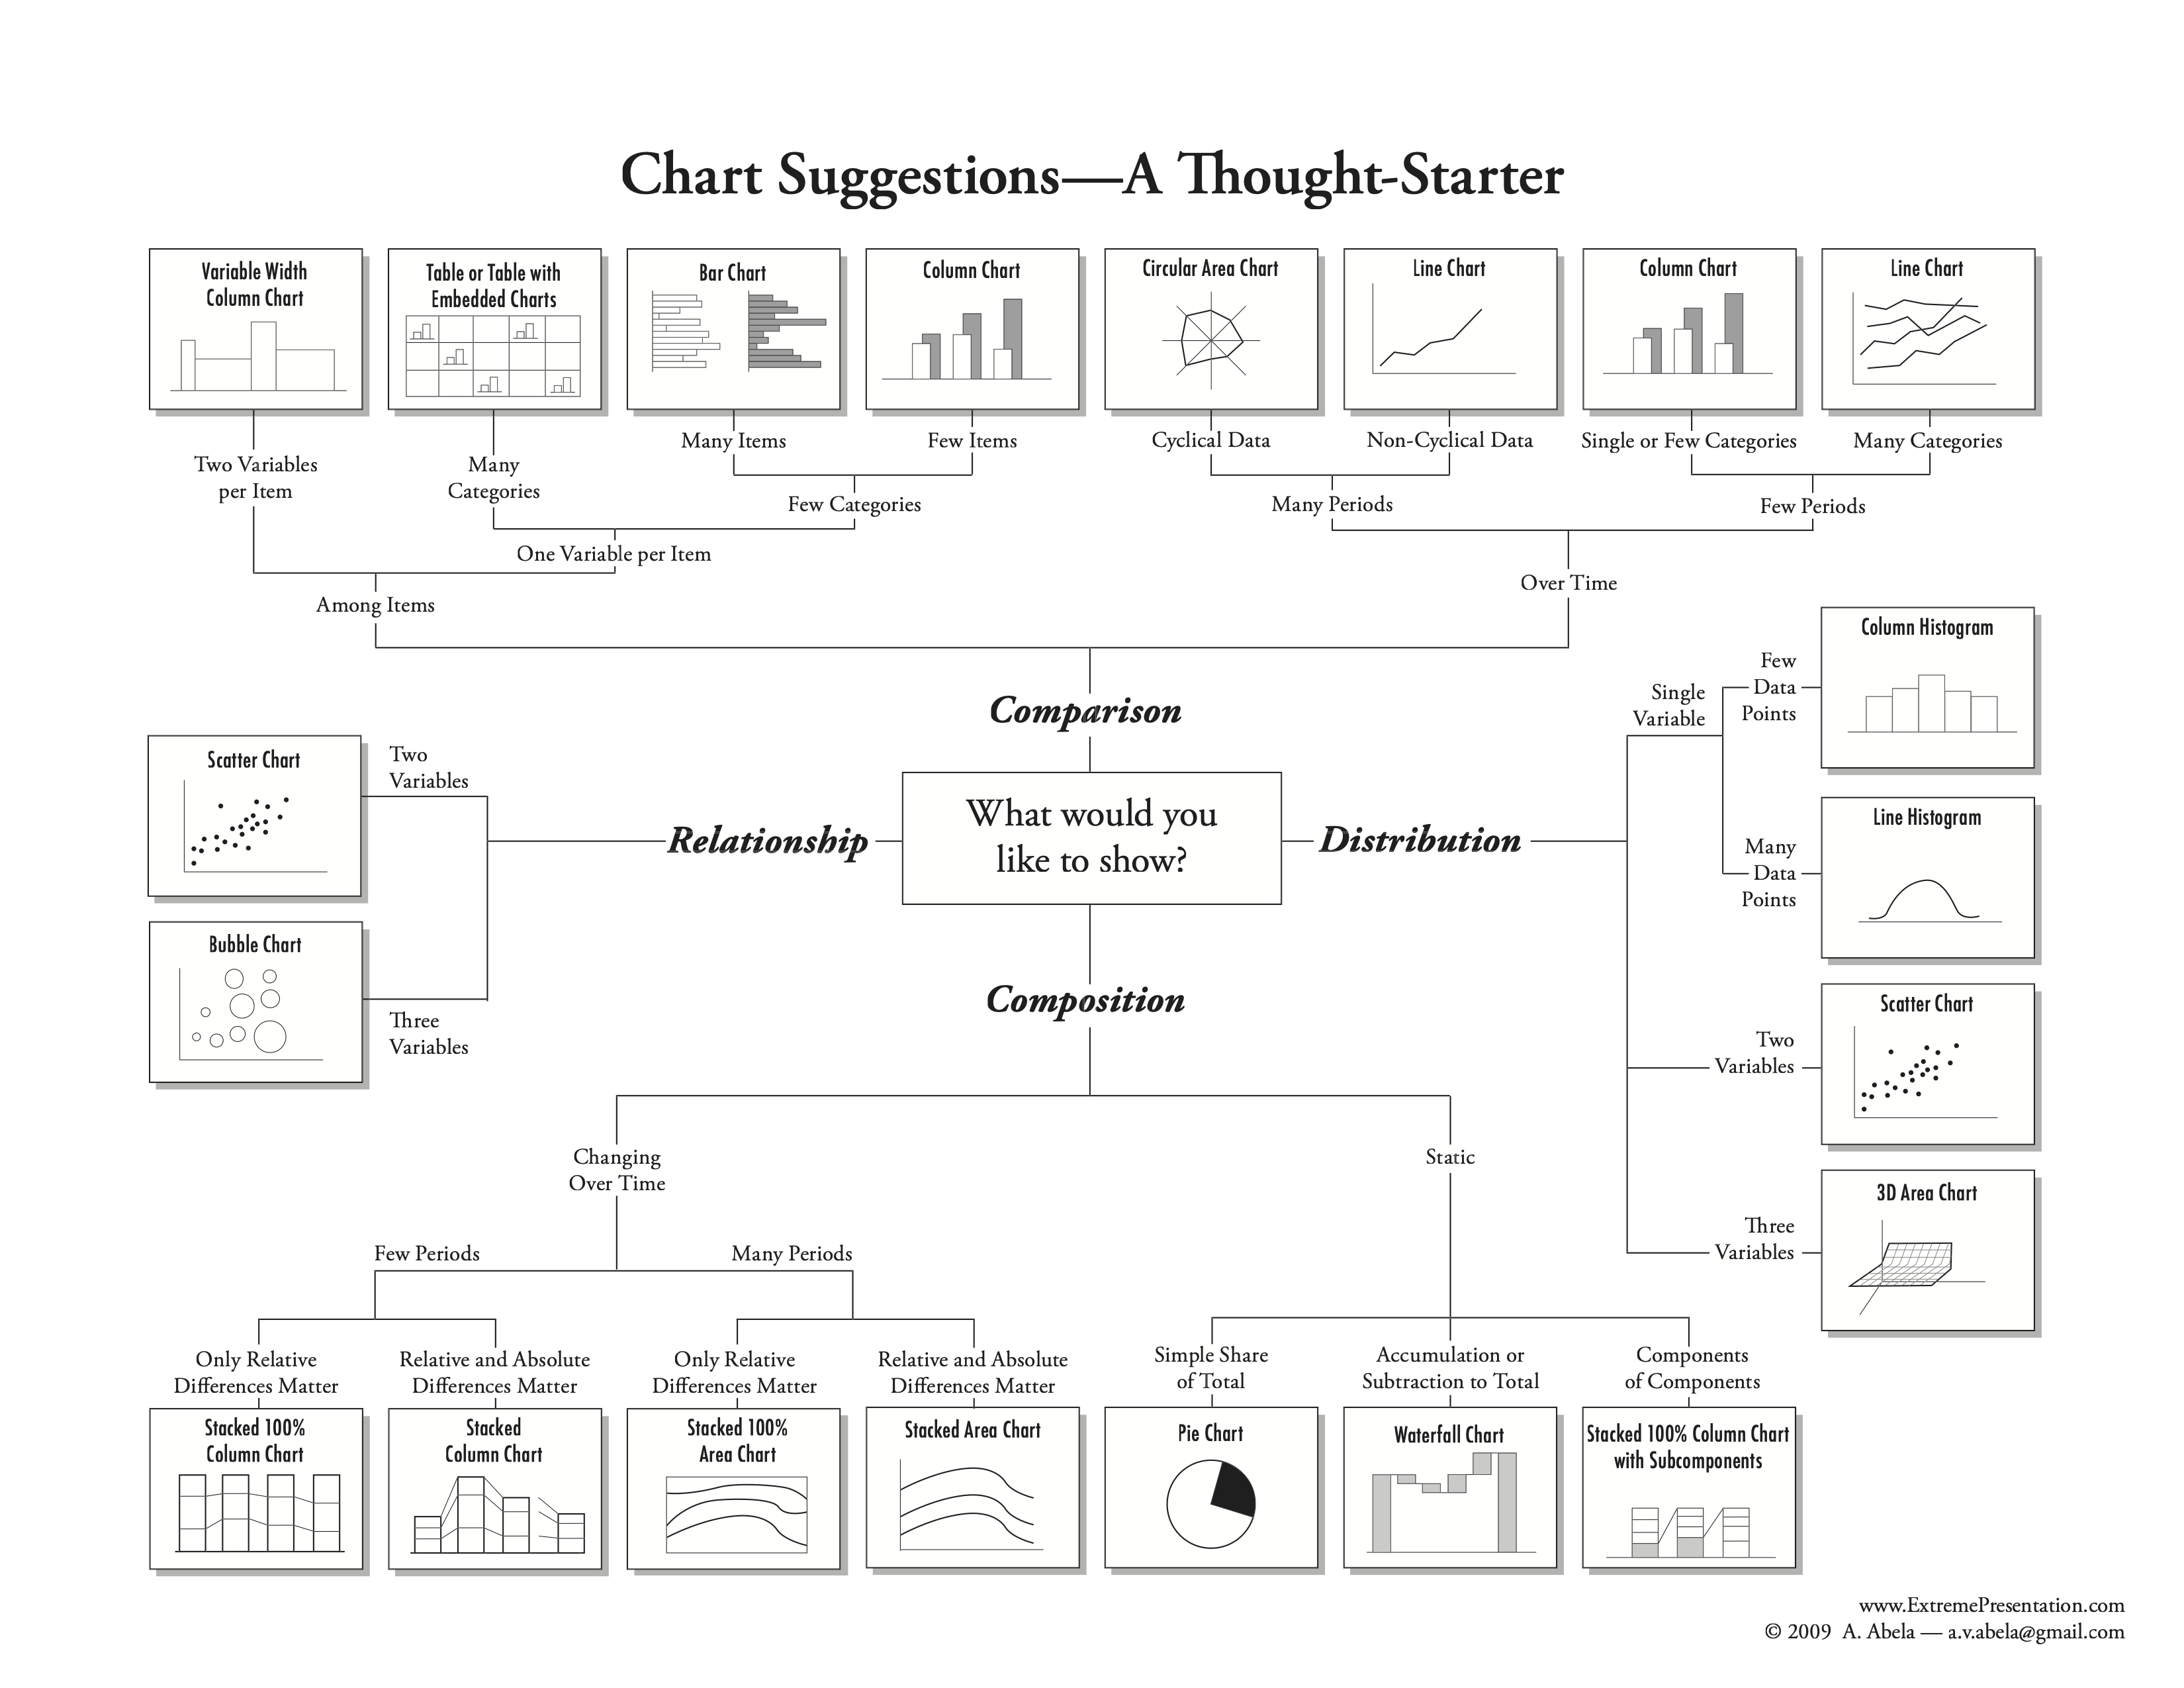
task taxonomies are vague
how do we decide what chart to use?
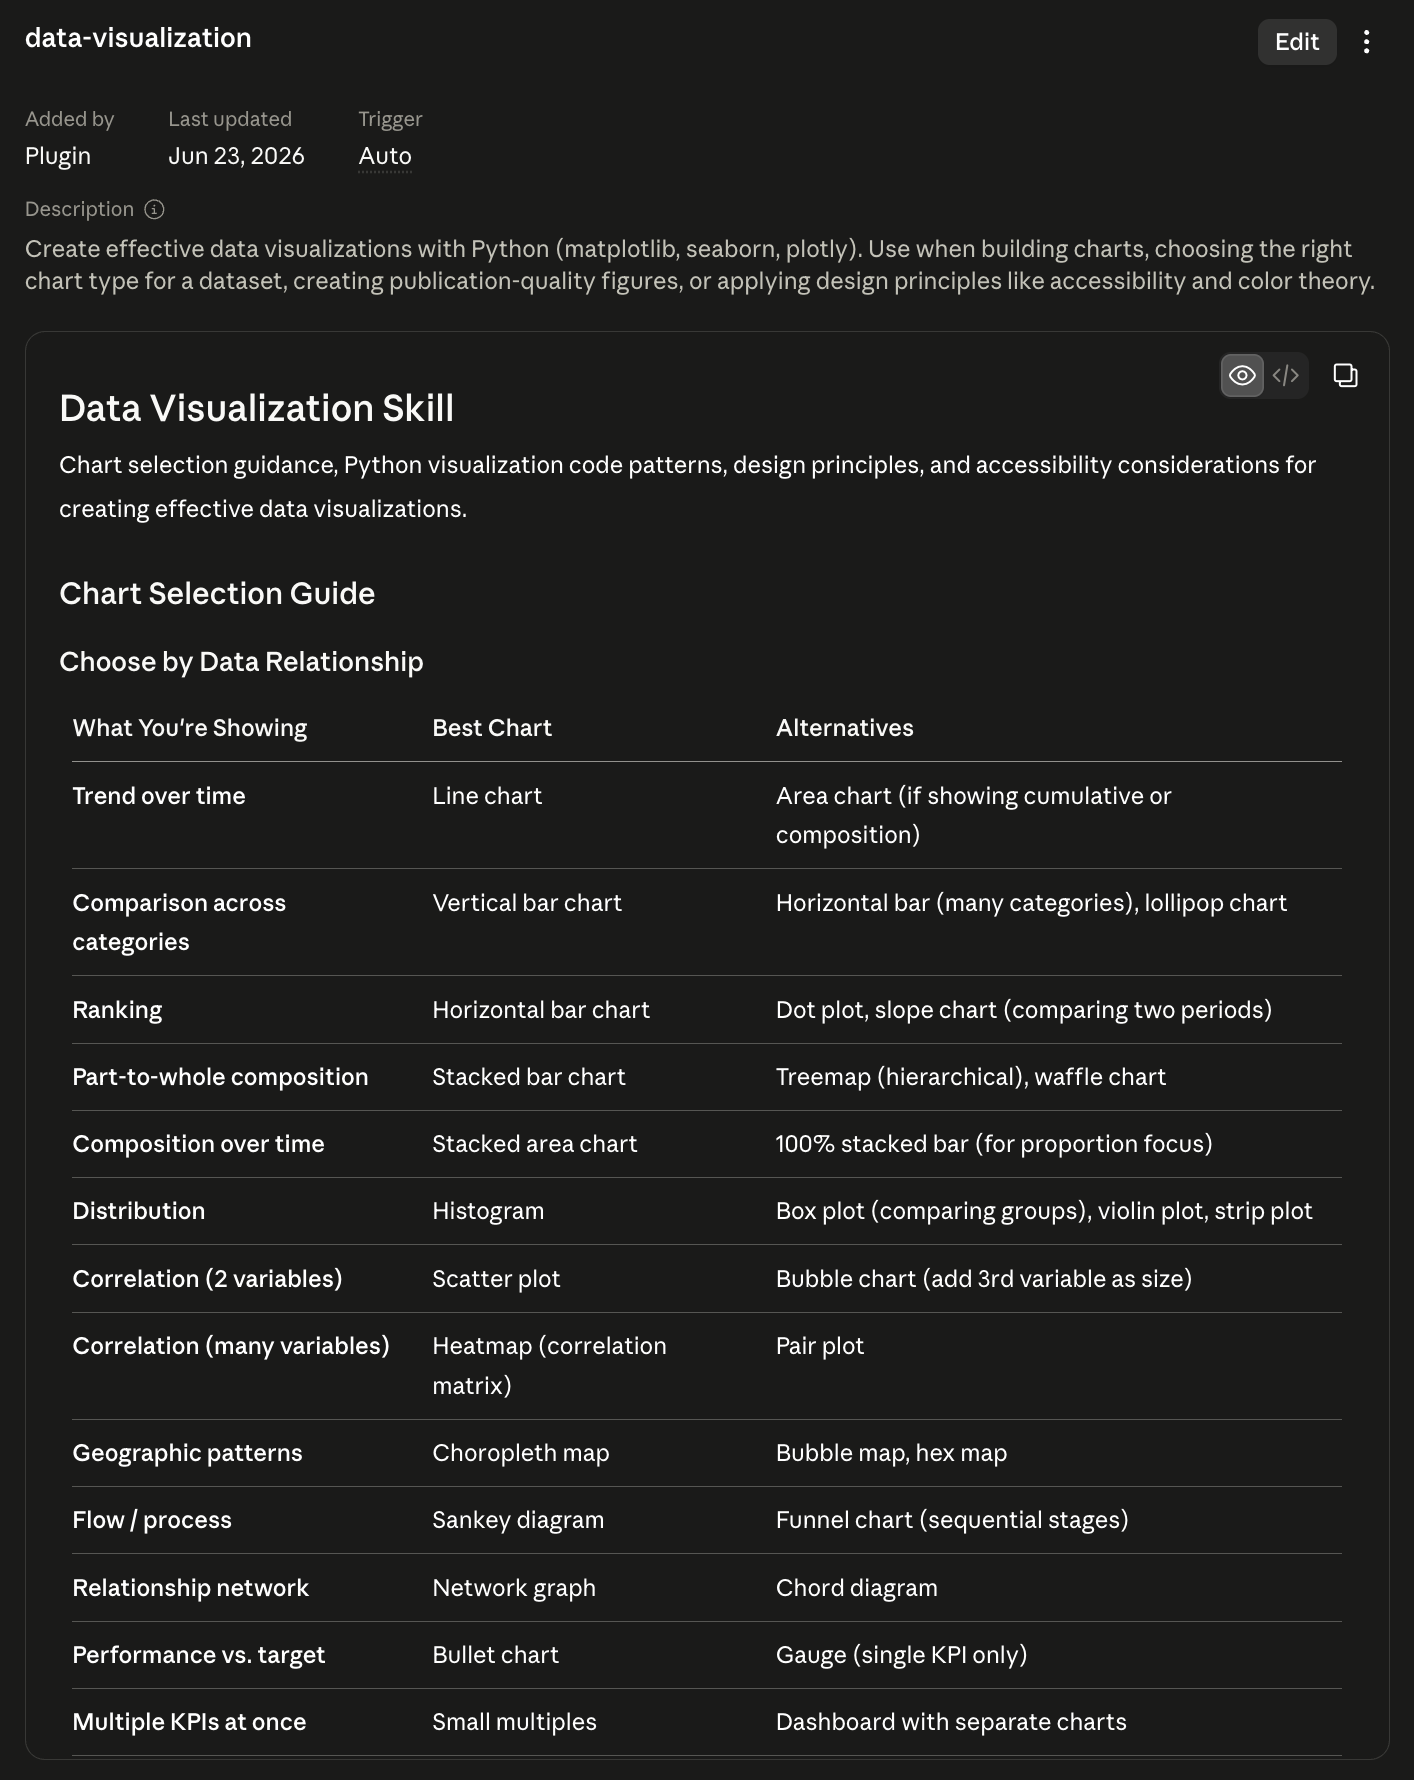
ossified into AI skills
The problem
menus become rules
This chart is good. This chart is bad. Use this color scheme, not that one.
Rules are useful, but brittle. They tend to be all-or-nothing just when scientific graphics need judgment.
and often that's fine
but what about the long tail
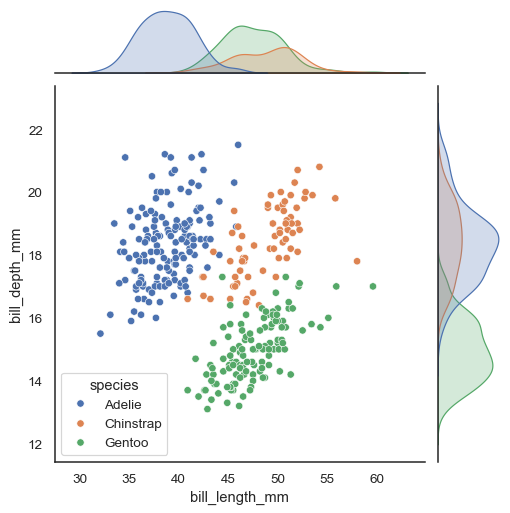
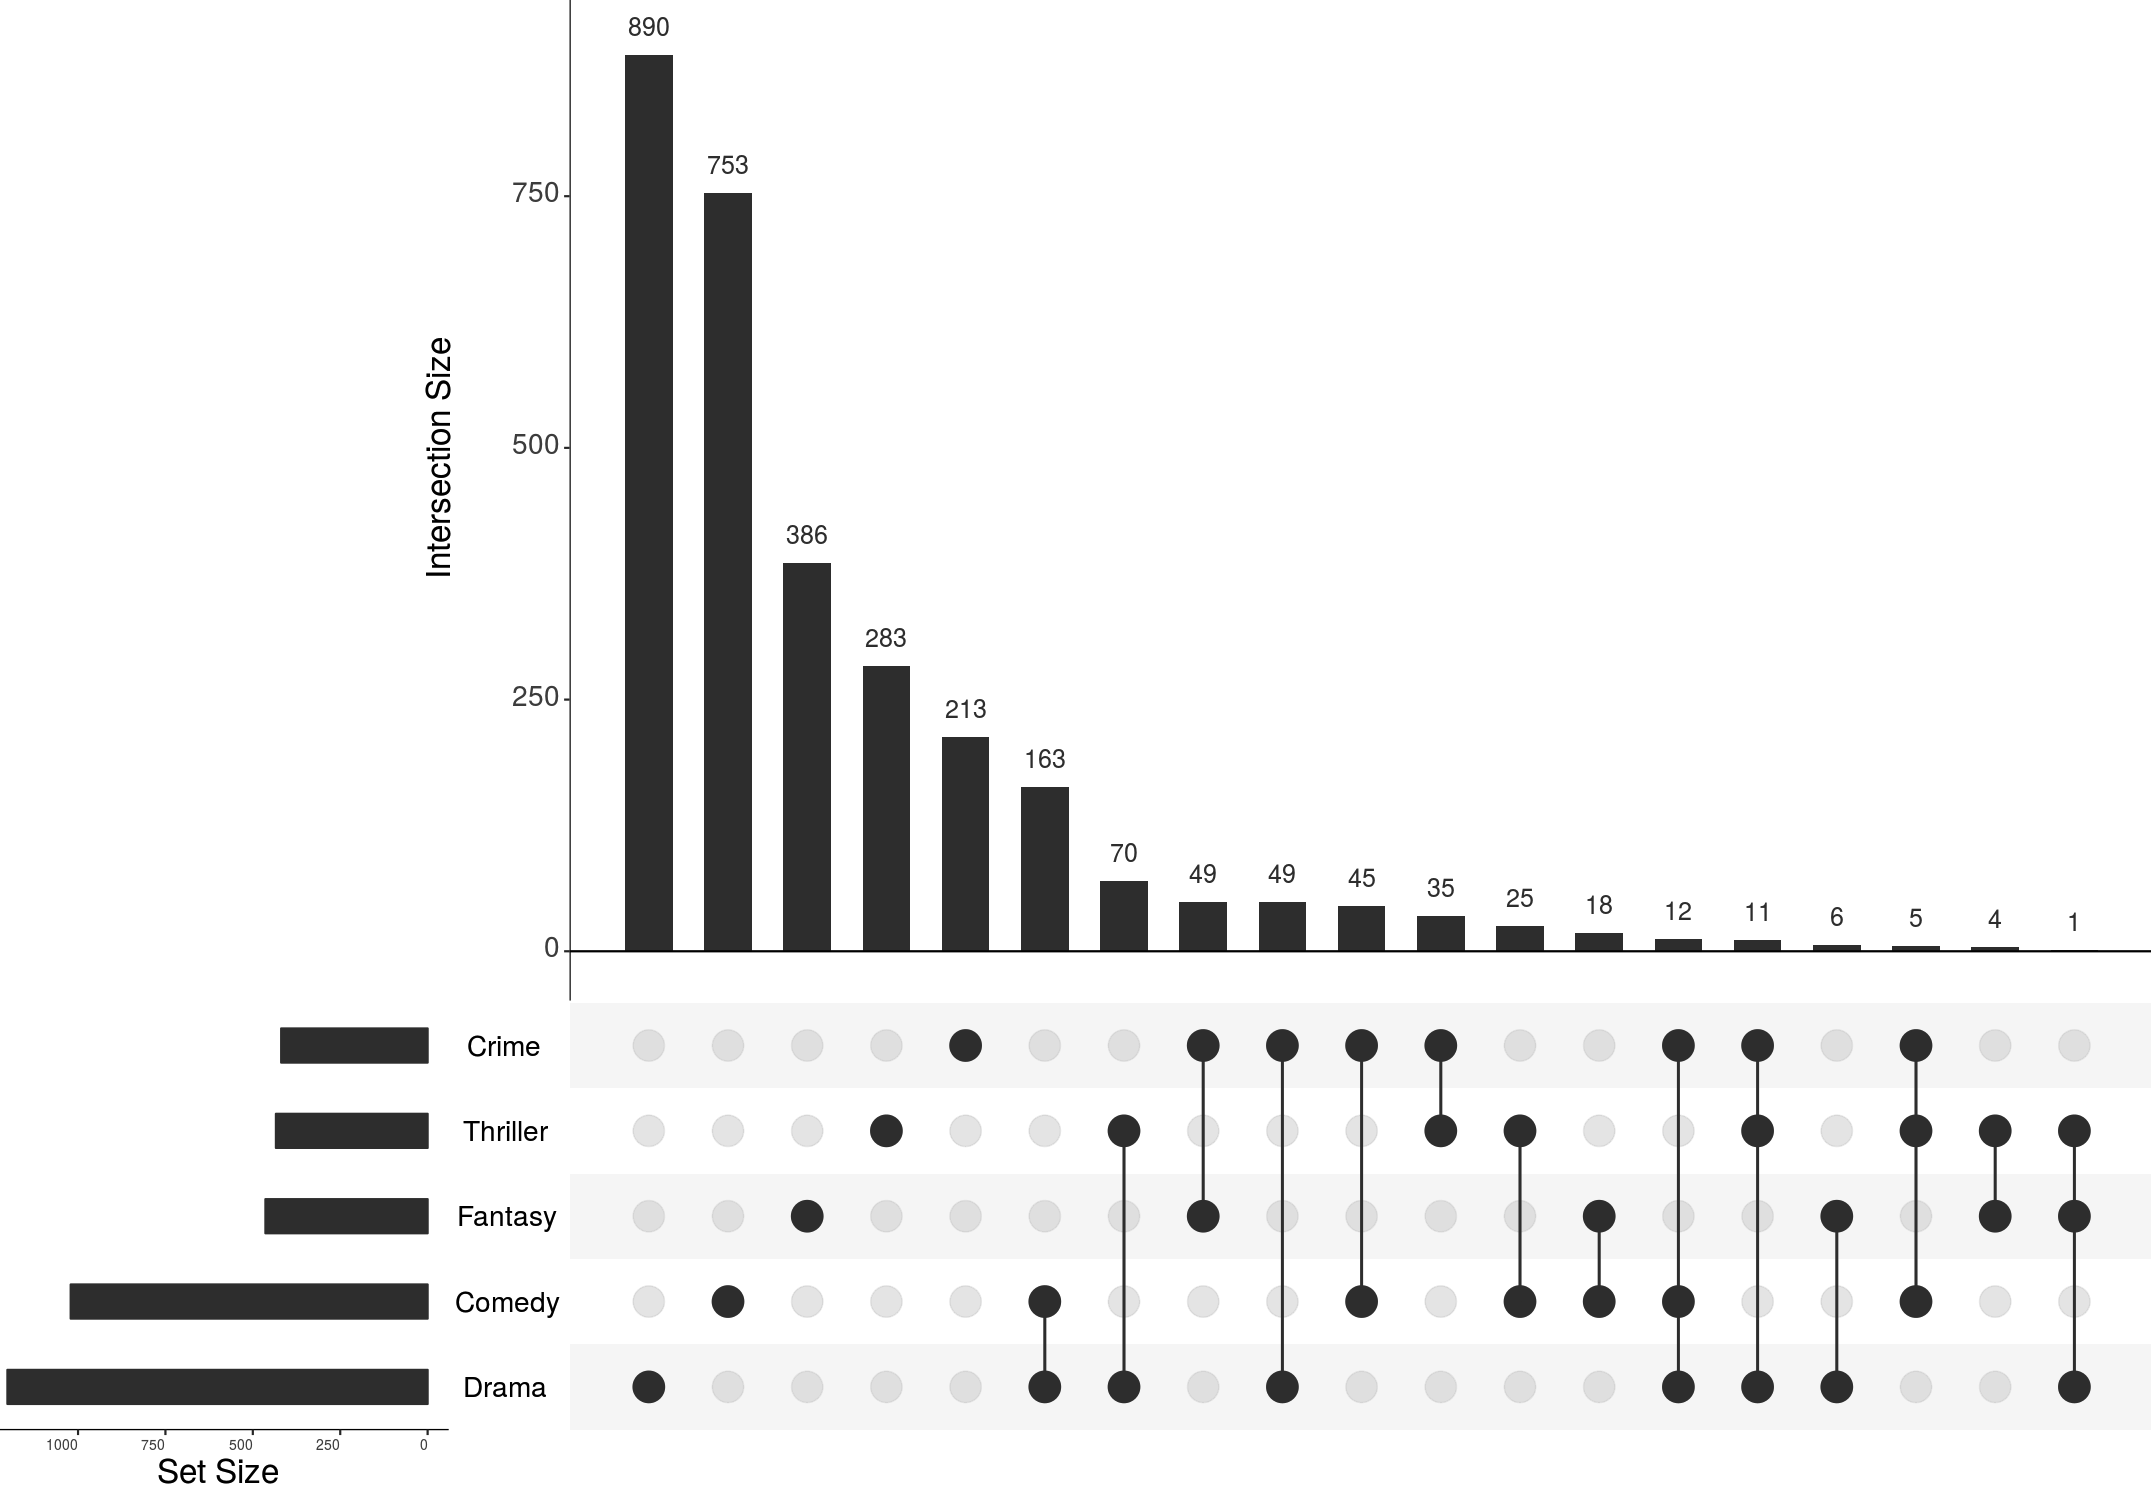
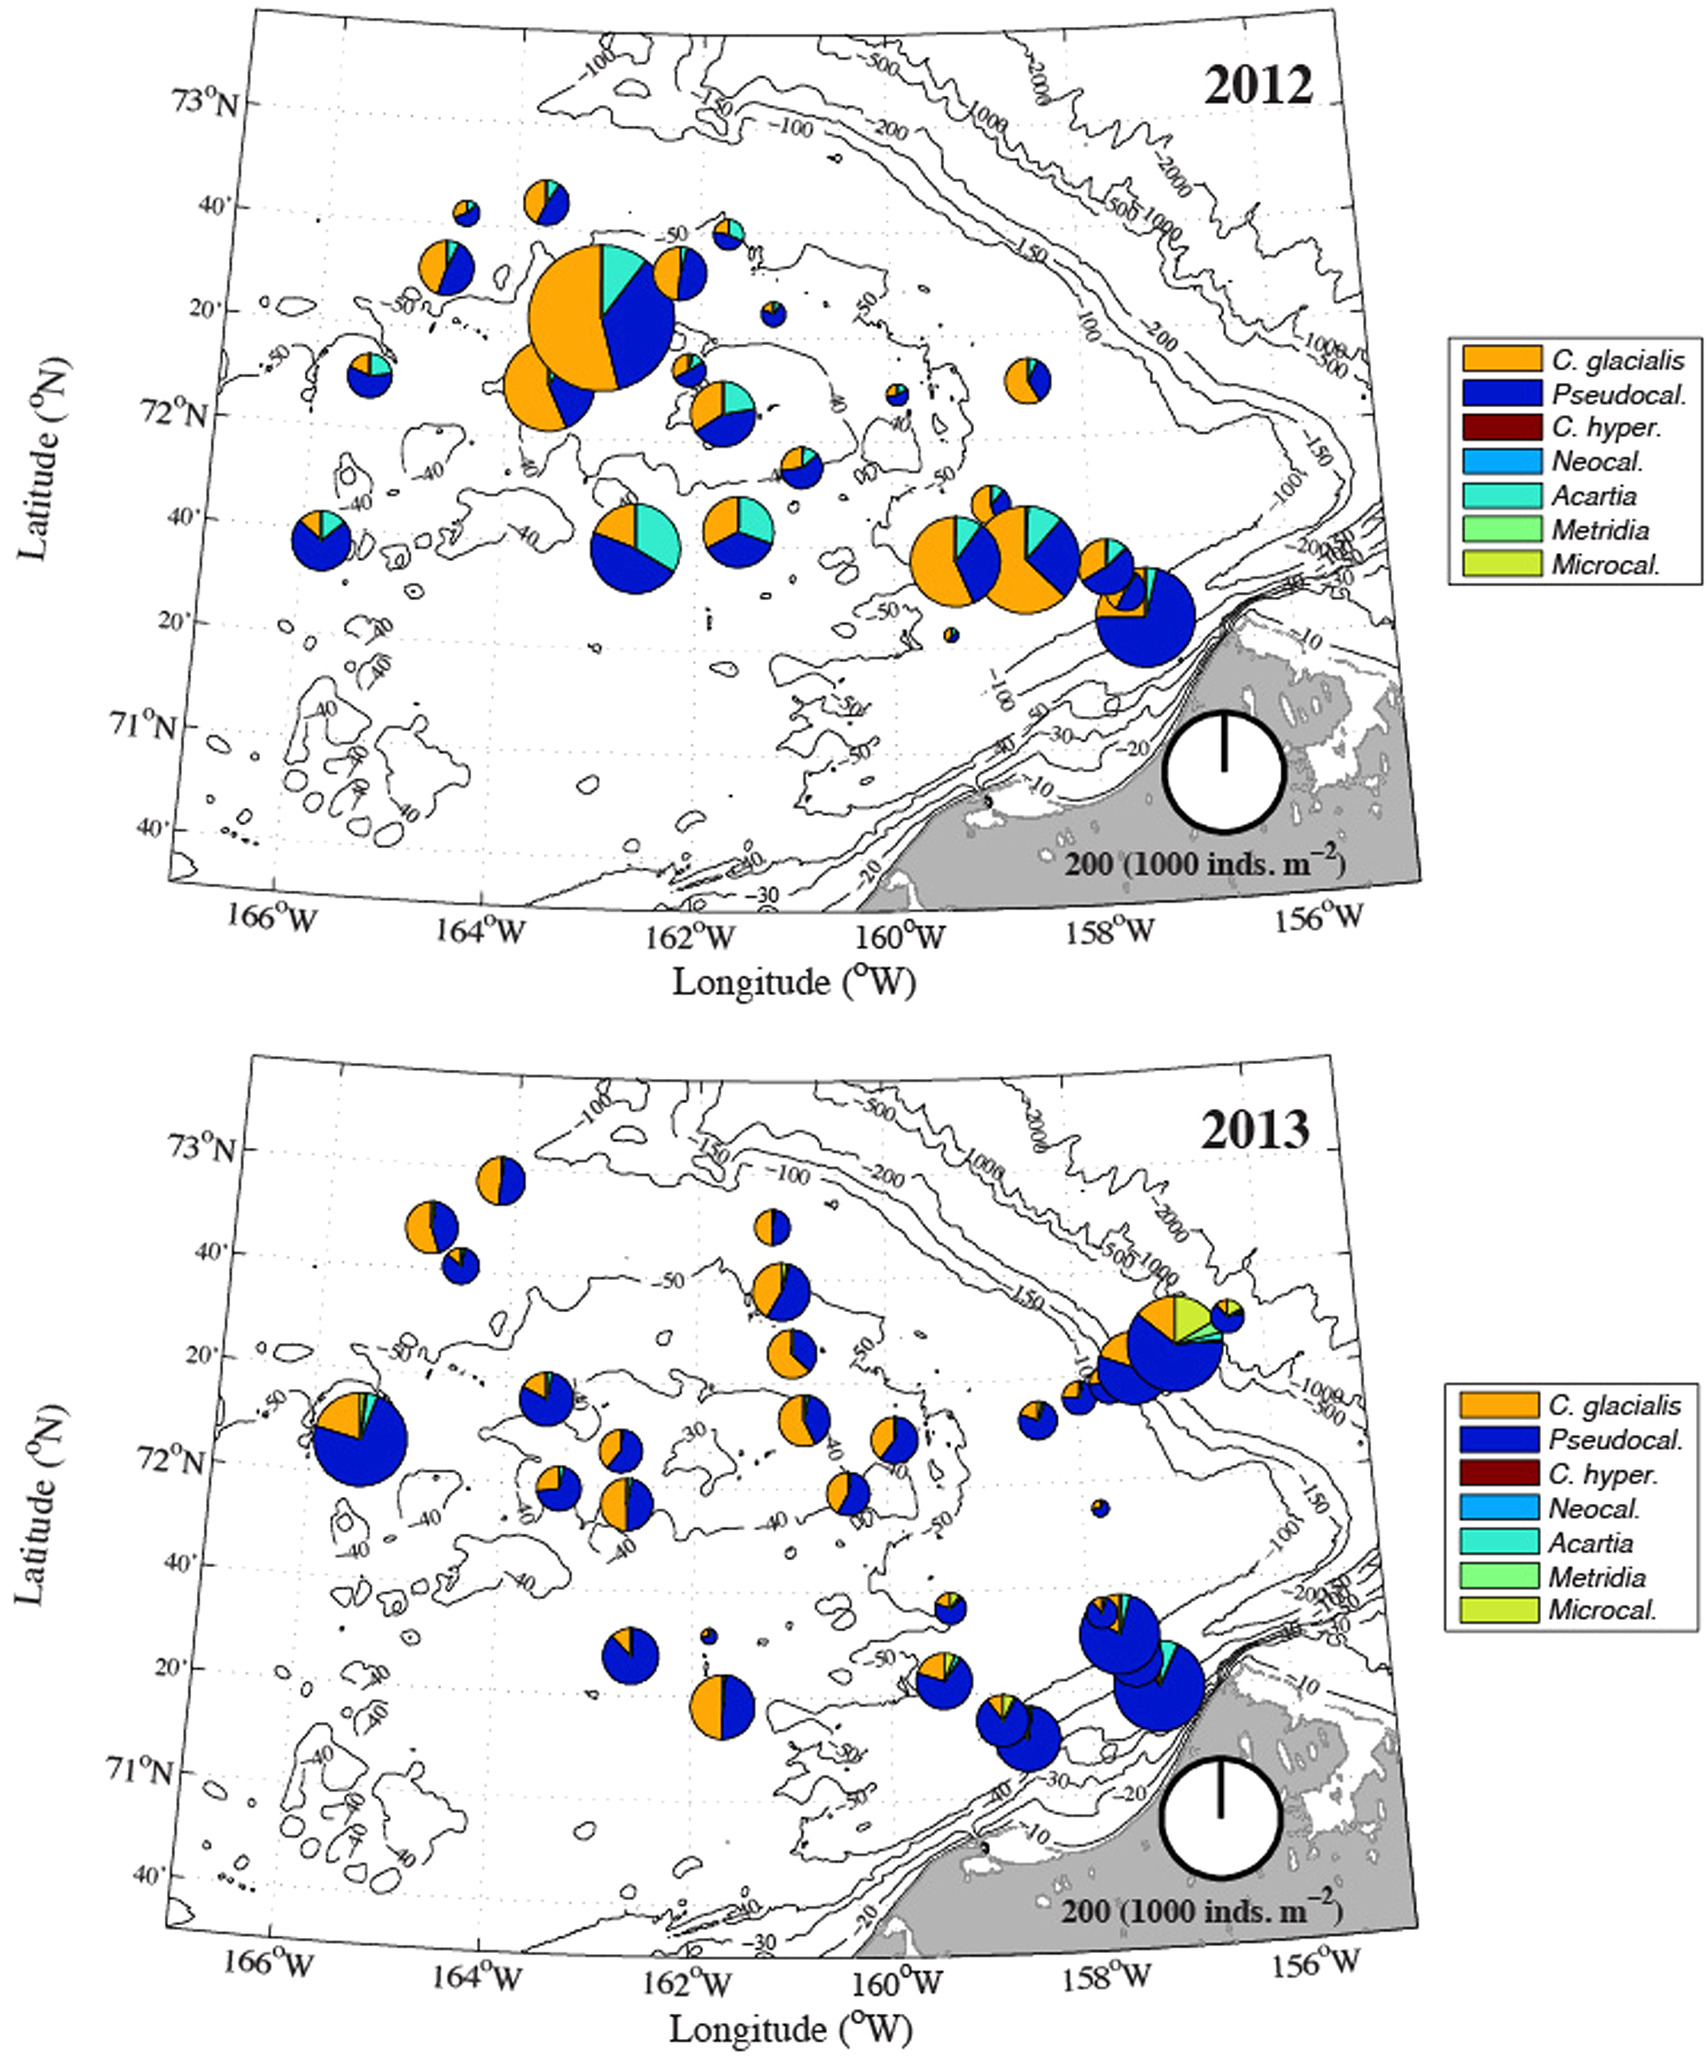
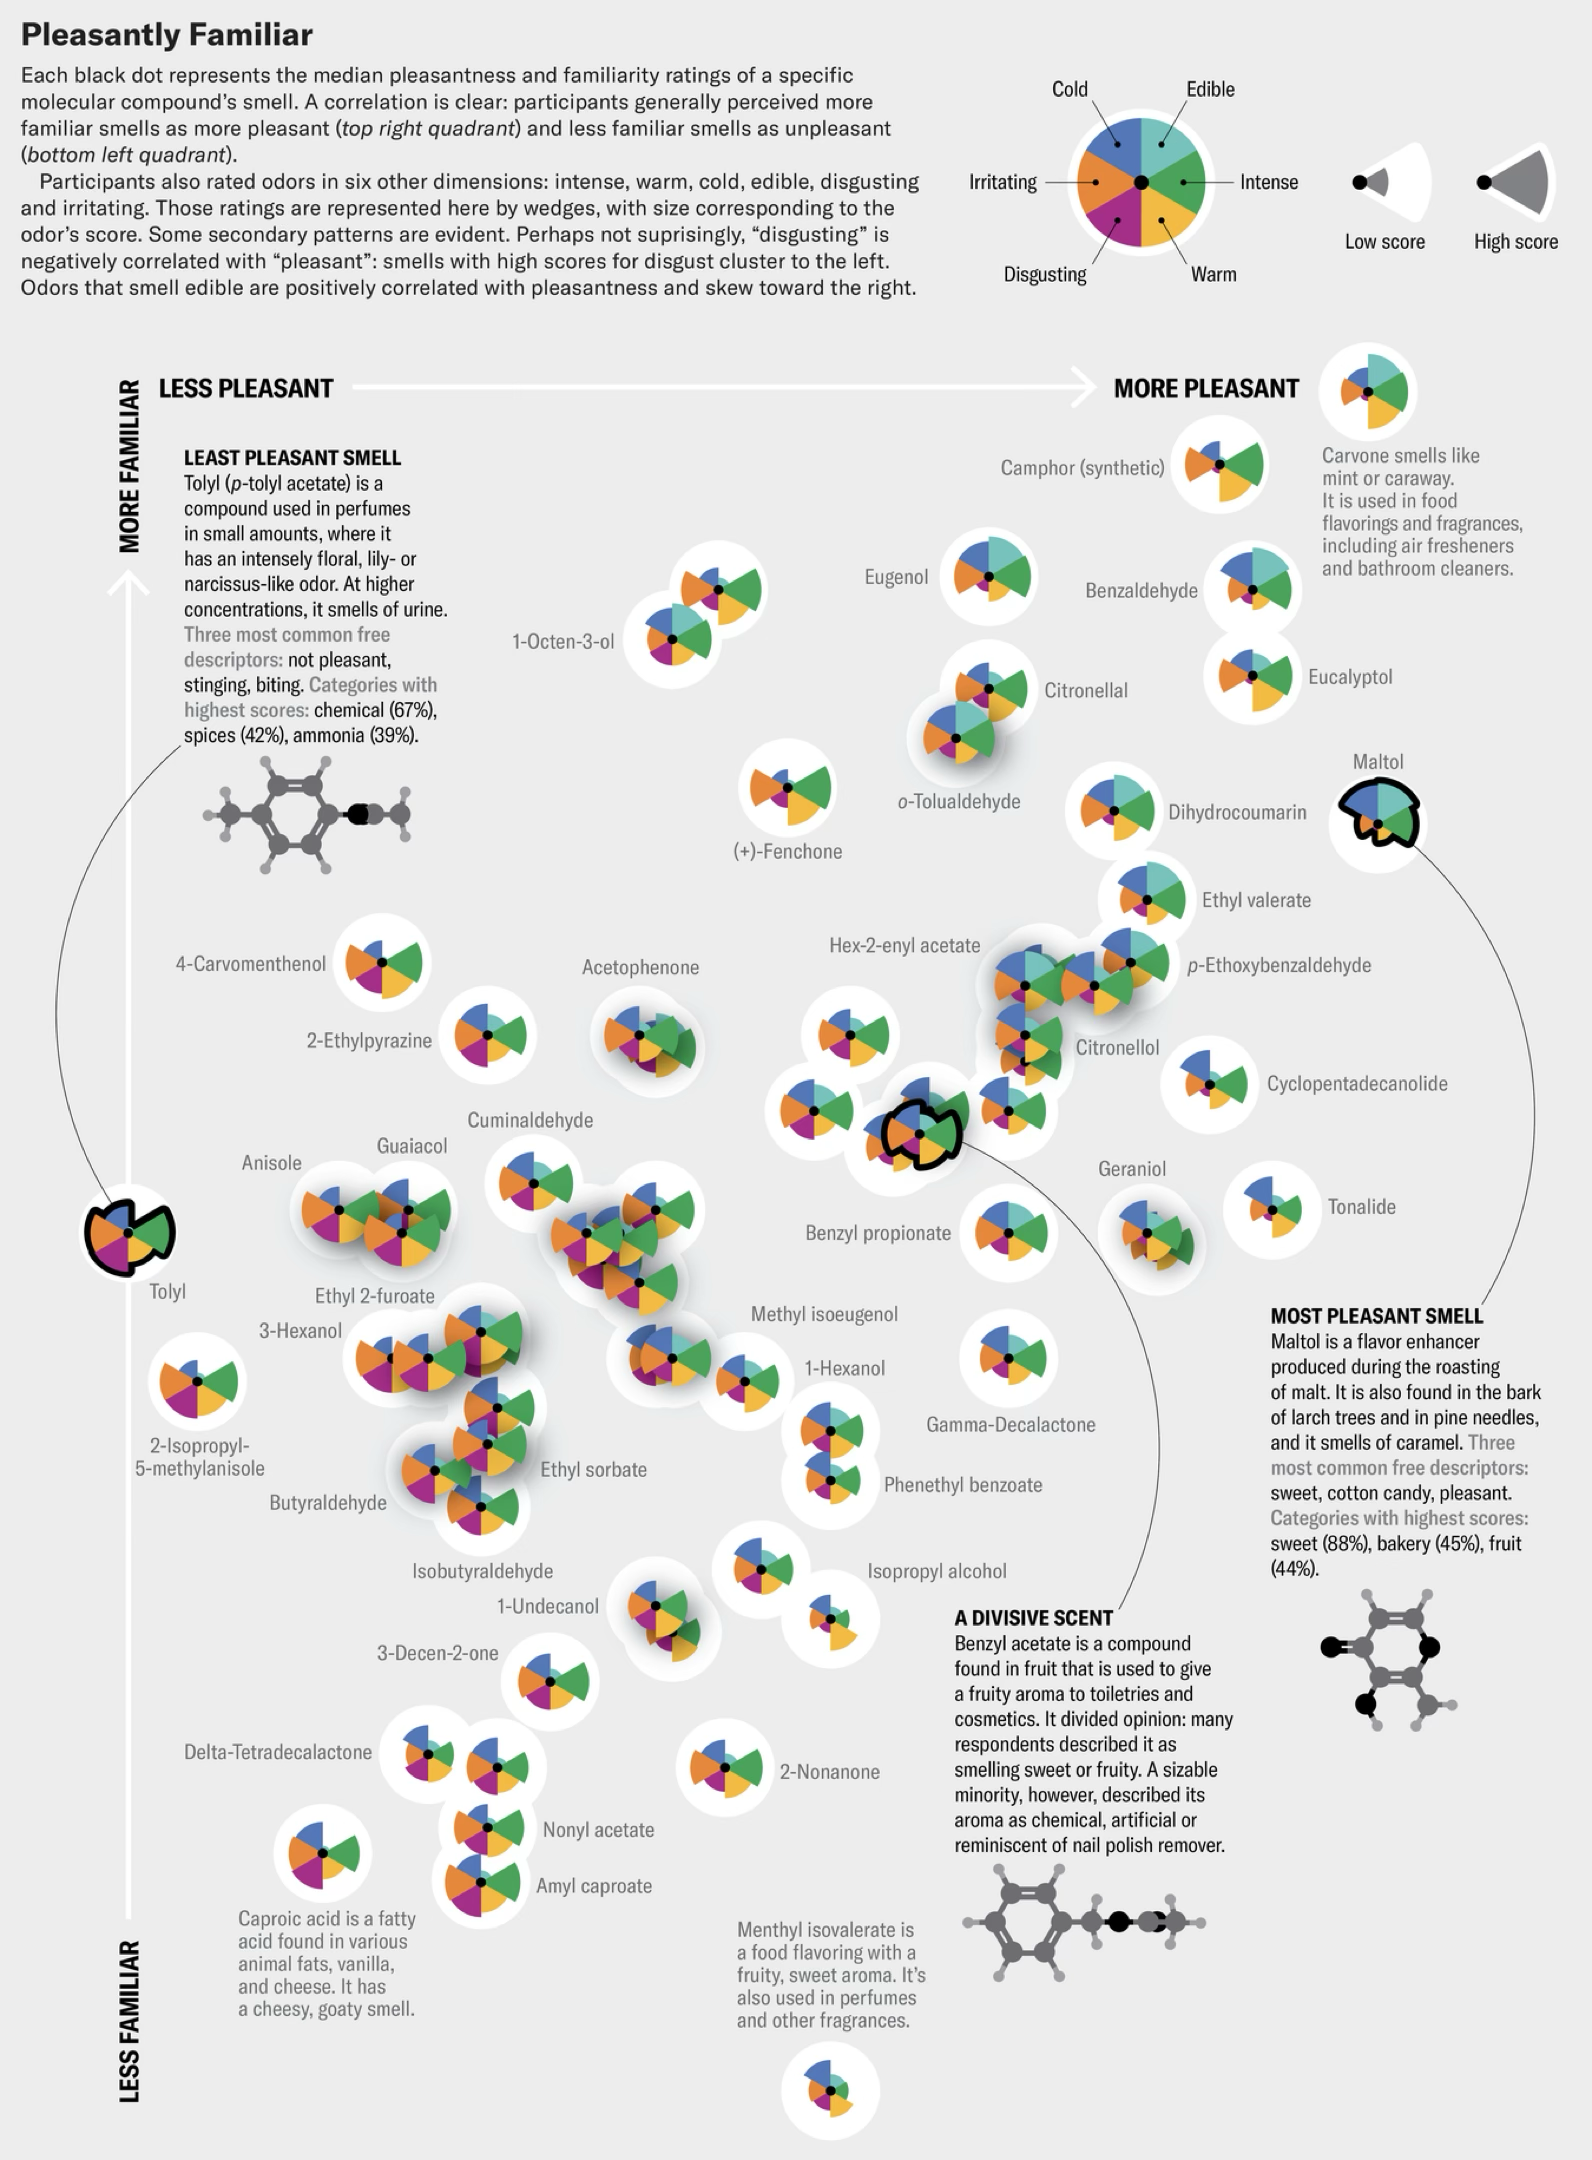
how do we figure out what to make?
how do we make it?
The stance
I'm a stylistic anarchist
Not anti-style. Anti brittle rules.
A prerequisite to designing good graphics is seeing what they are doing as clearly as possible, before ranking them by type.
grammar vs elements of style
A better lens
Grammar names the relationships. Style controls the voice.
Grammar
containment, alignment, connection, order, scale, emphasis
Style
palette, texture, typography, density, ornament, tone
graphics don't always fall into neat taxonomies
here's a grouped bar chart
what did you notice about the data?
here's another one
what did you notice now?
what about now?
how about now?
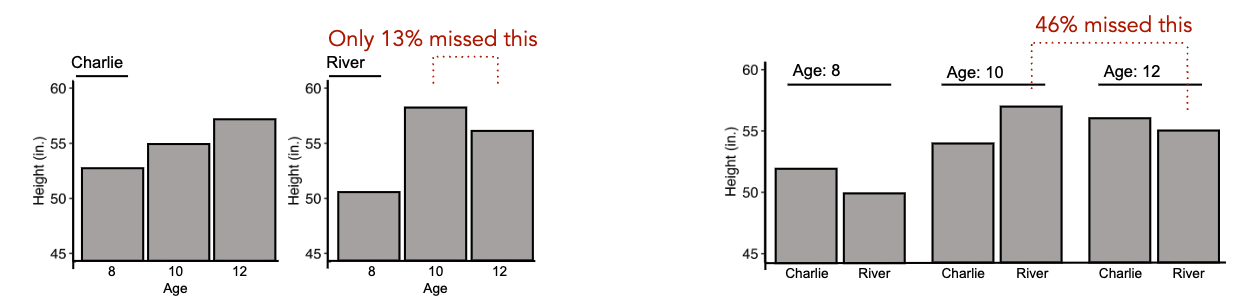
these are all grouped bar charts, but we read them differently!
by the way: this is real data
the grammar of graphics: marks, channels, and coordinates
marks (shapes)
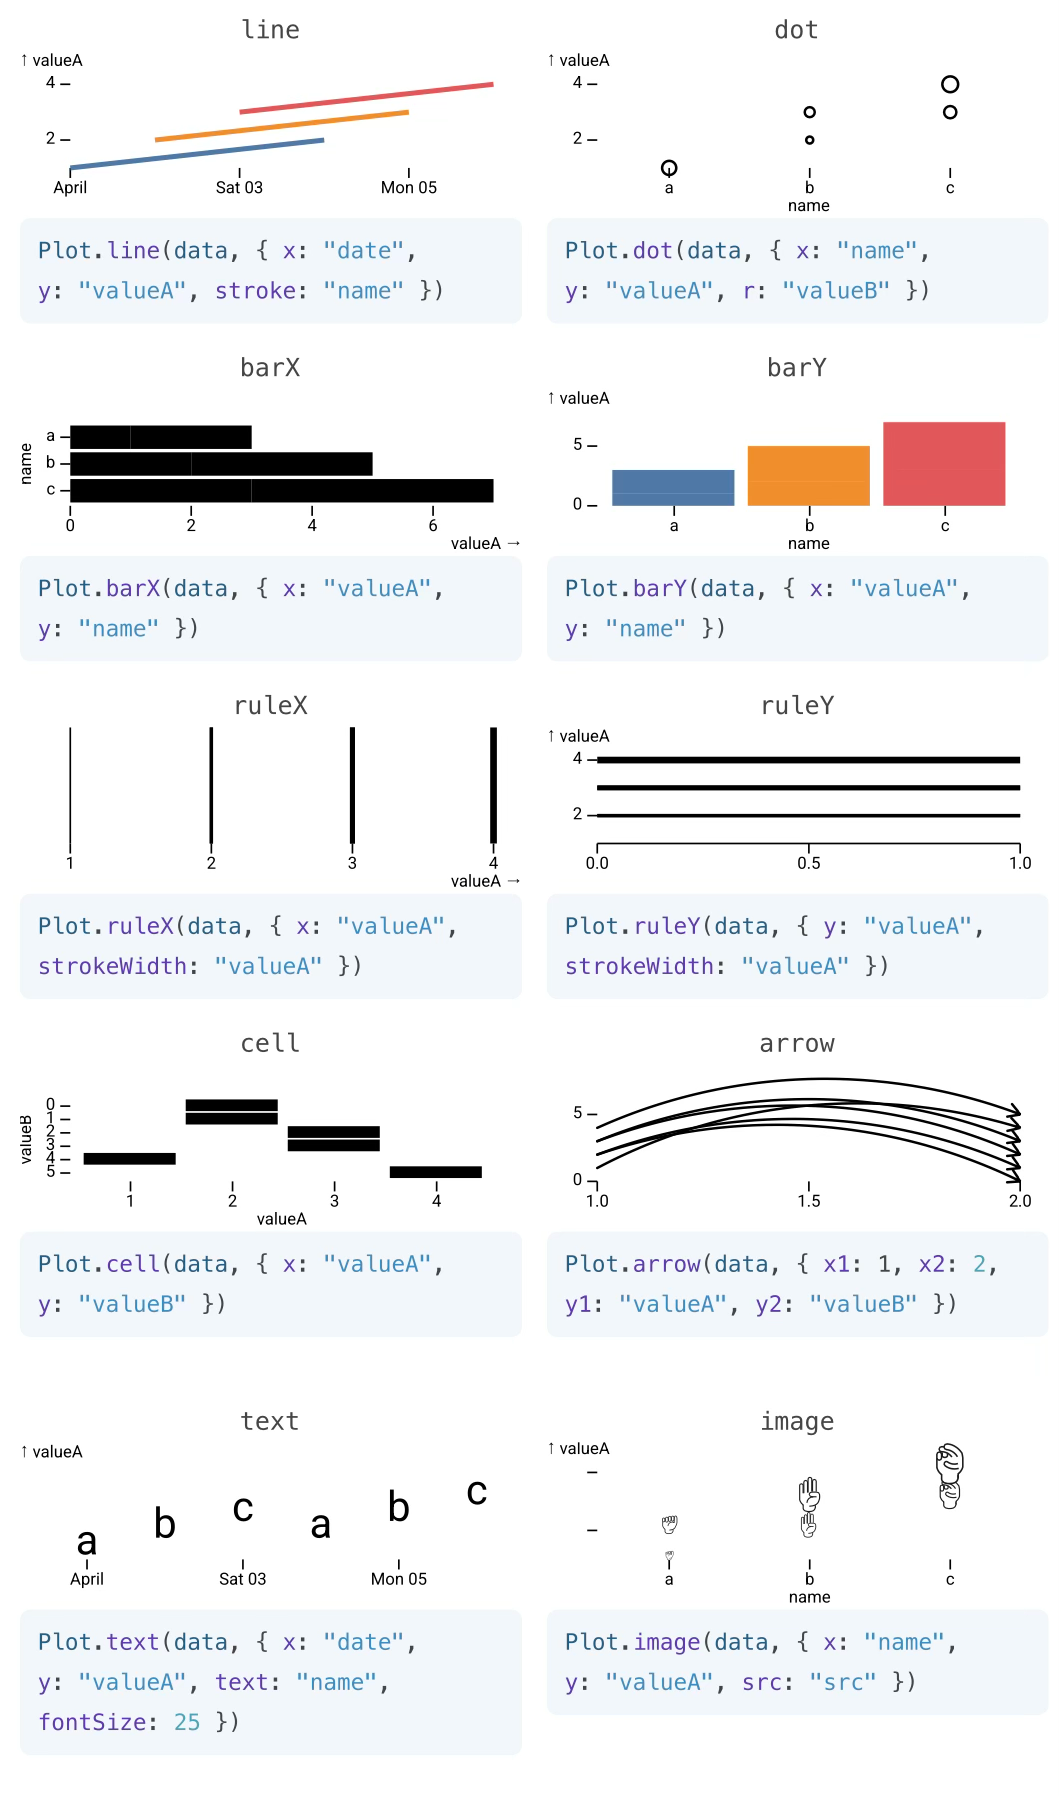
Observable Plot
channels (shape attributes)
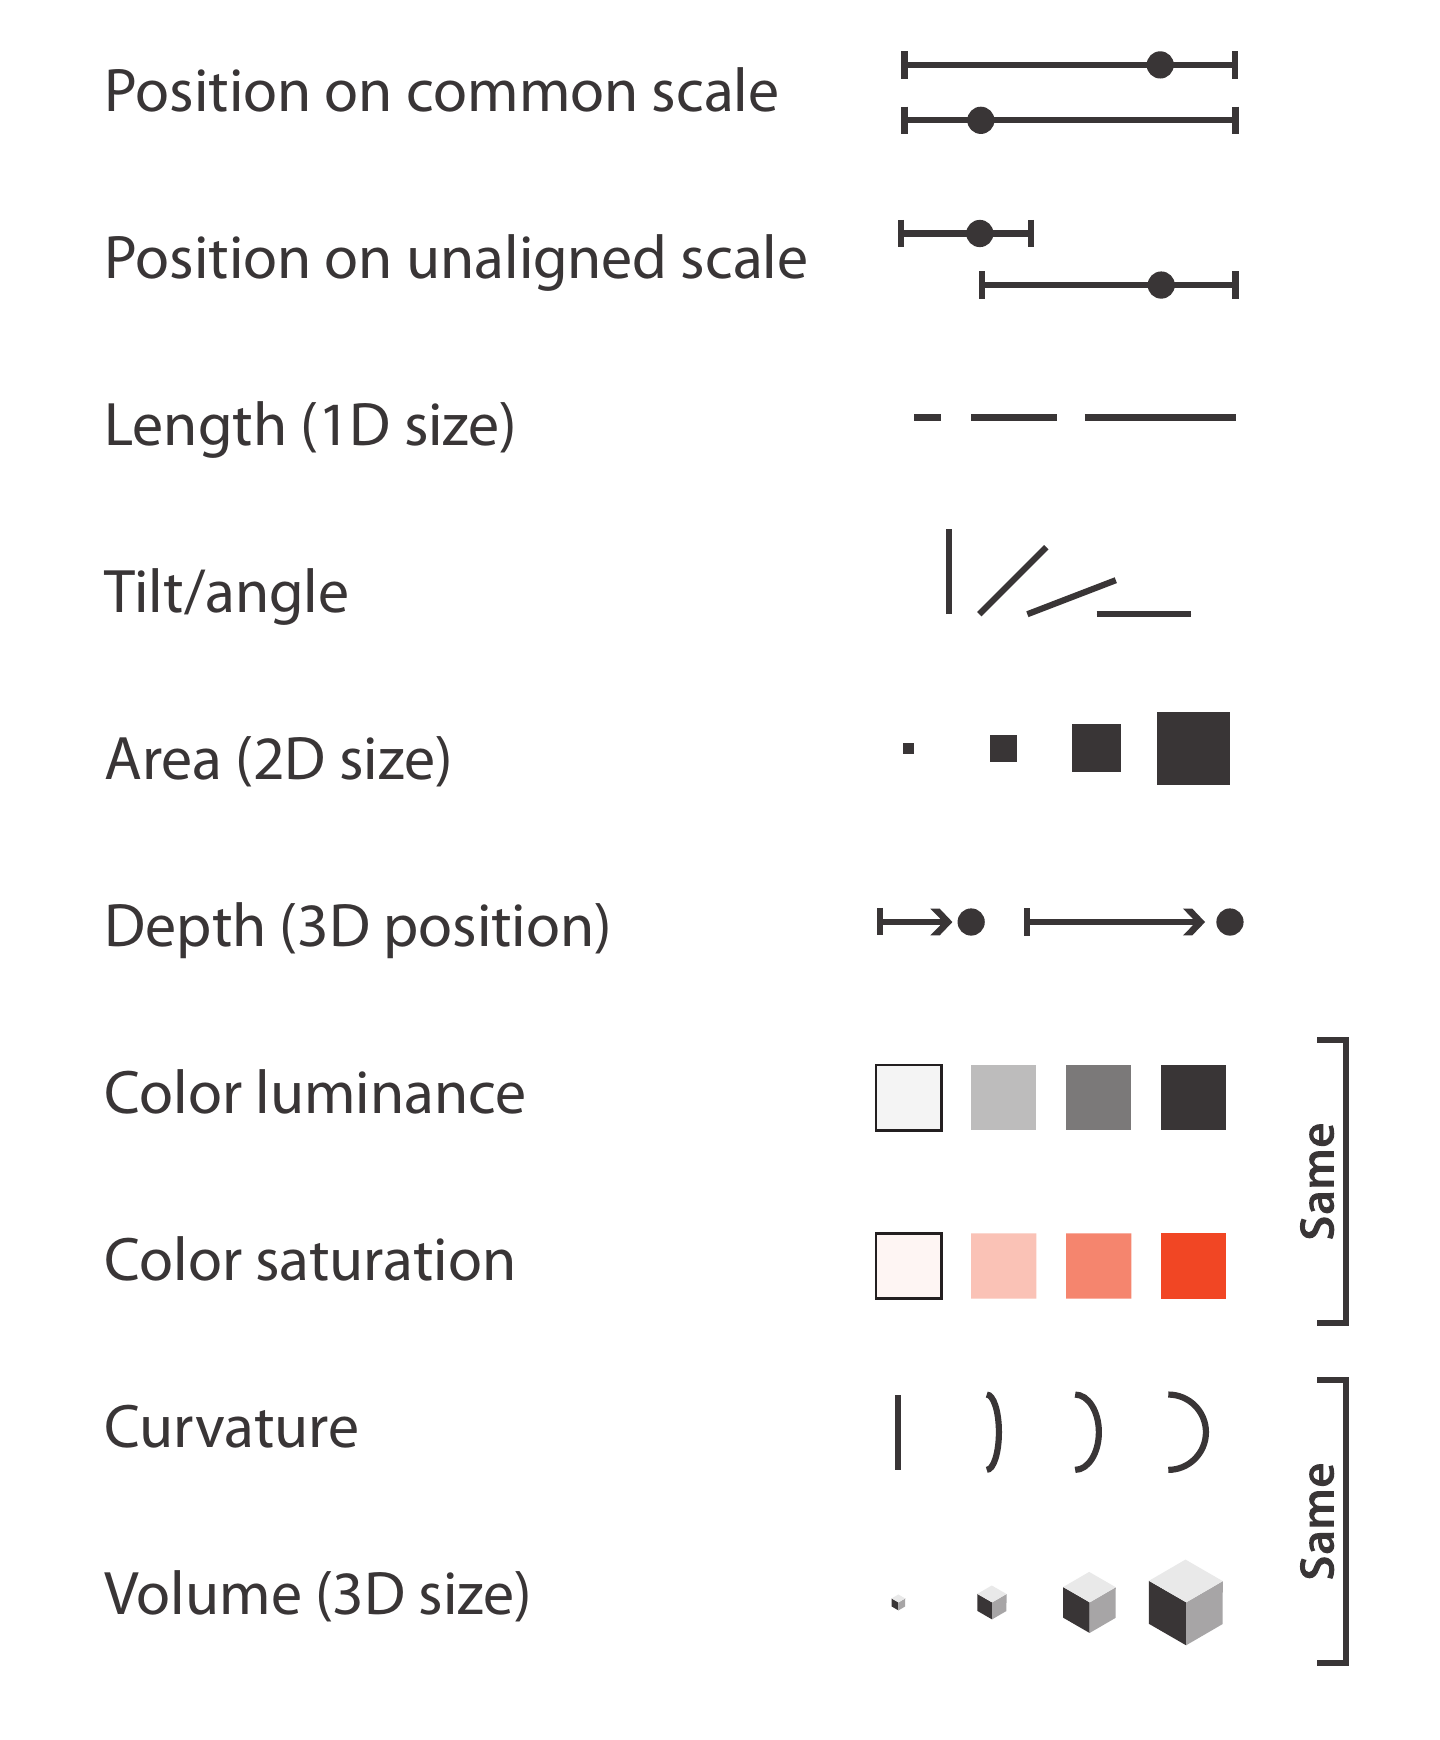
Munzner, Visualization Analysis and Design (2014)
coordinates (space transformations)
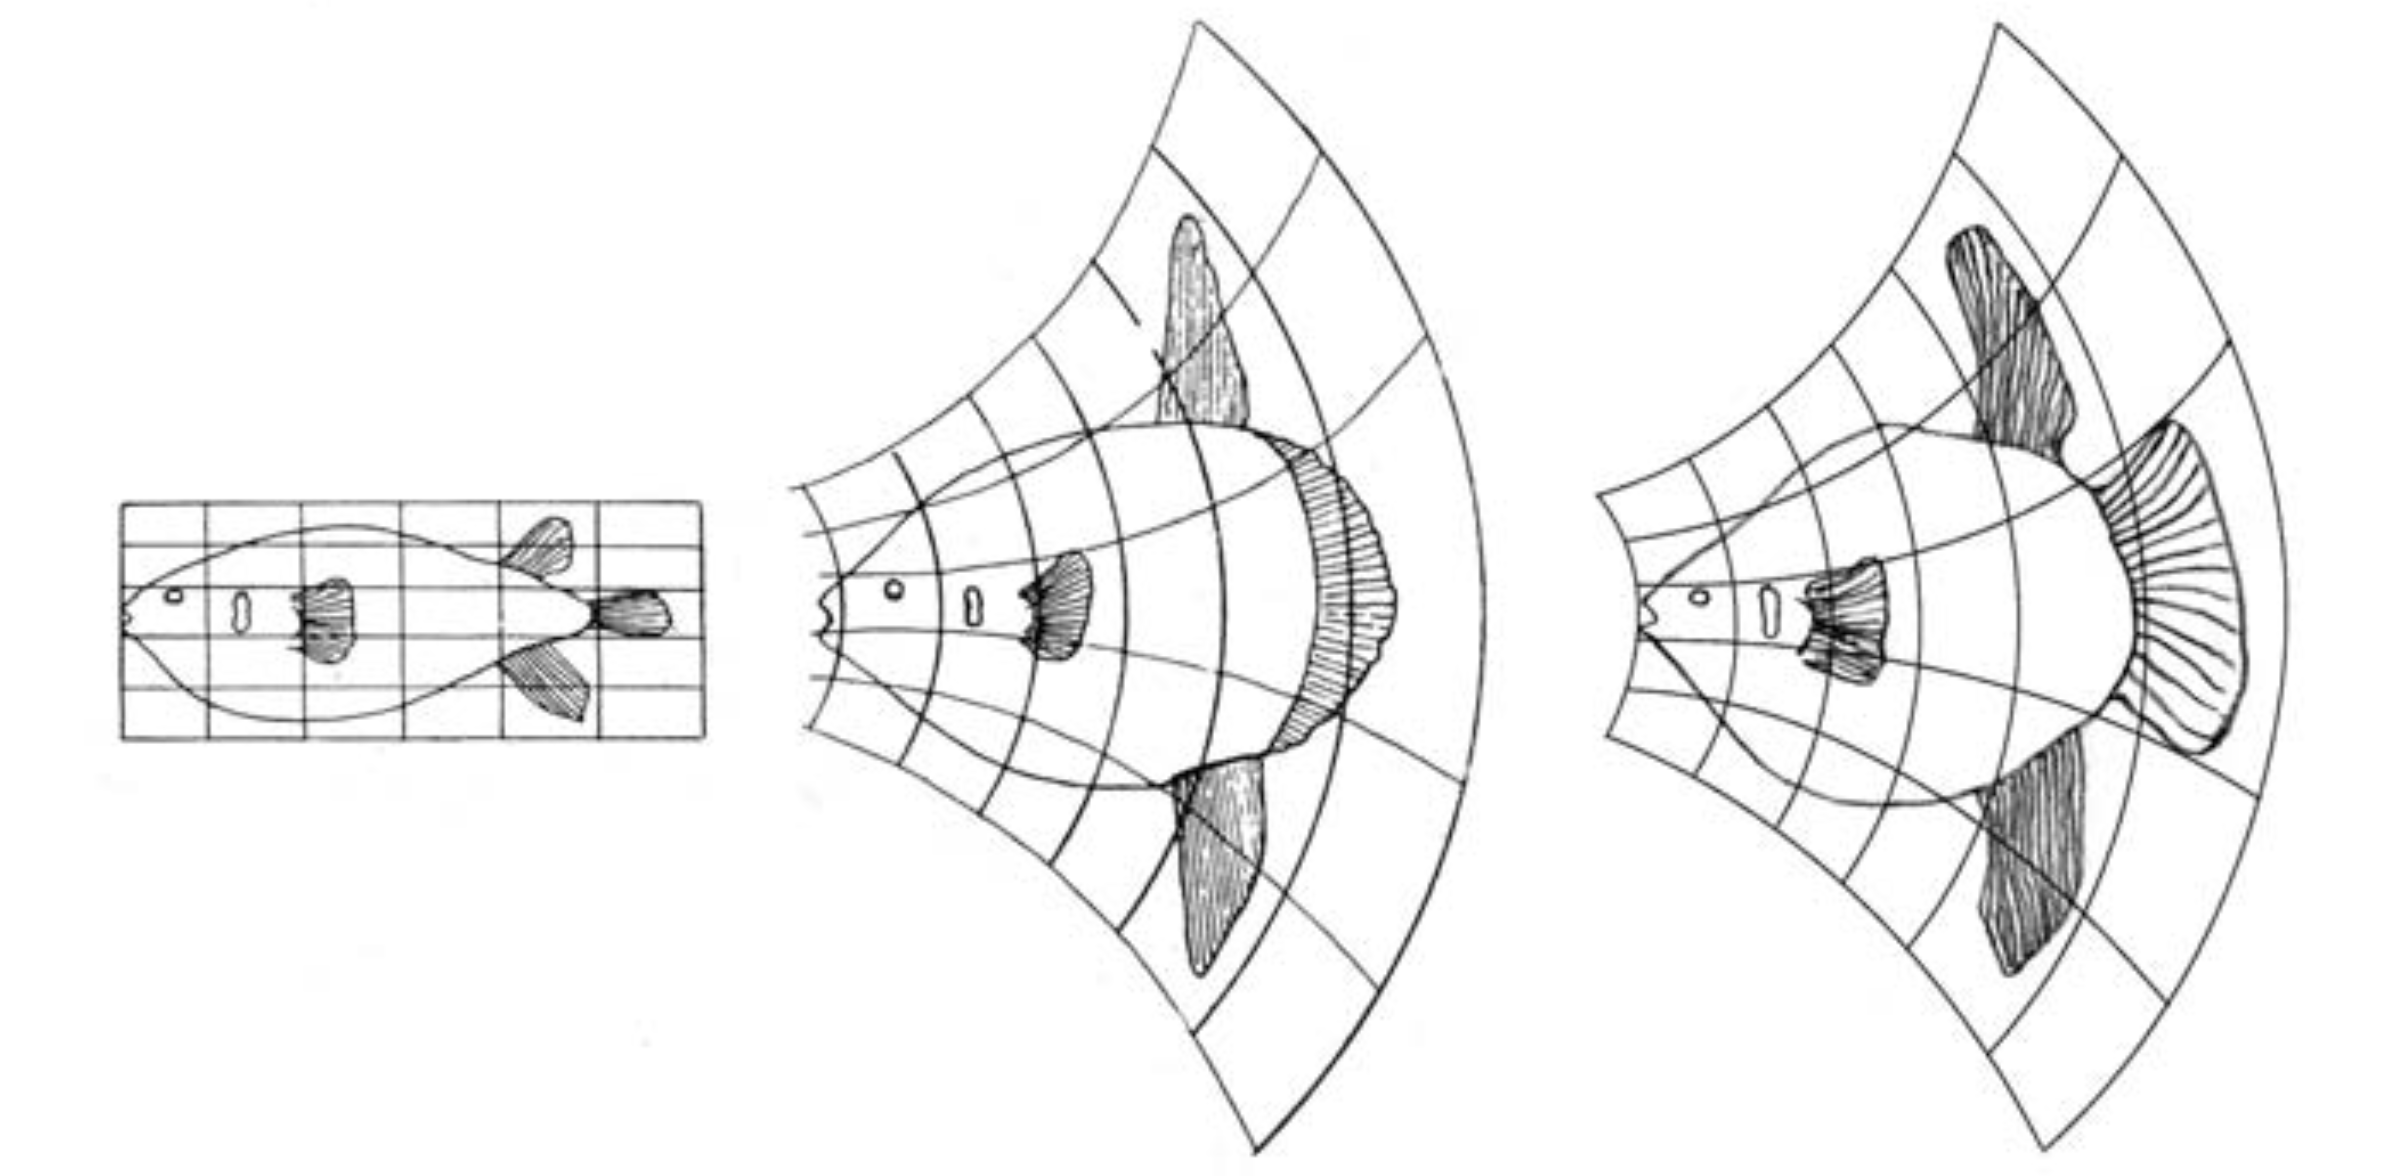
Thompson’s growth transformation · via Wilkinson, The Grammar of Graphics
but we need a notion of visual structure to explain what we just saw
Marks and channels tell us how precisely to read a value. They don't tell us which questions a chart makes easy.
graphics are visual data structures
that we query with our eyes 👀
structure changes what becomes easy to see
so we need two languages
1 · a language of graphical structure
2 · a language of perceptual queries
speculative, cutting-edge research. please push back!
GoFish
visual structure can help us describe both simple charts and very complex ones
familiar chart space
the long tail
beyond chart space

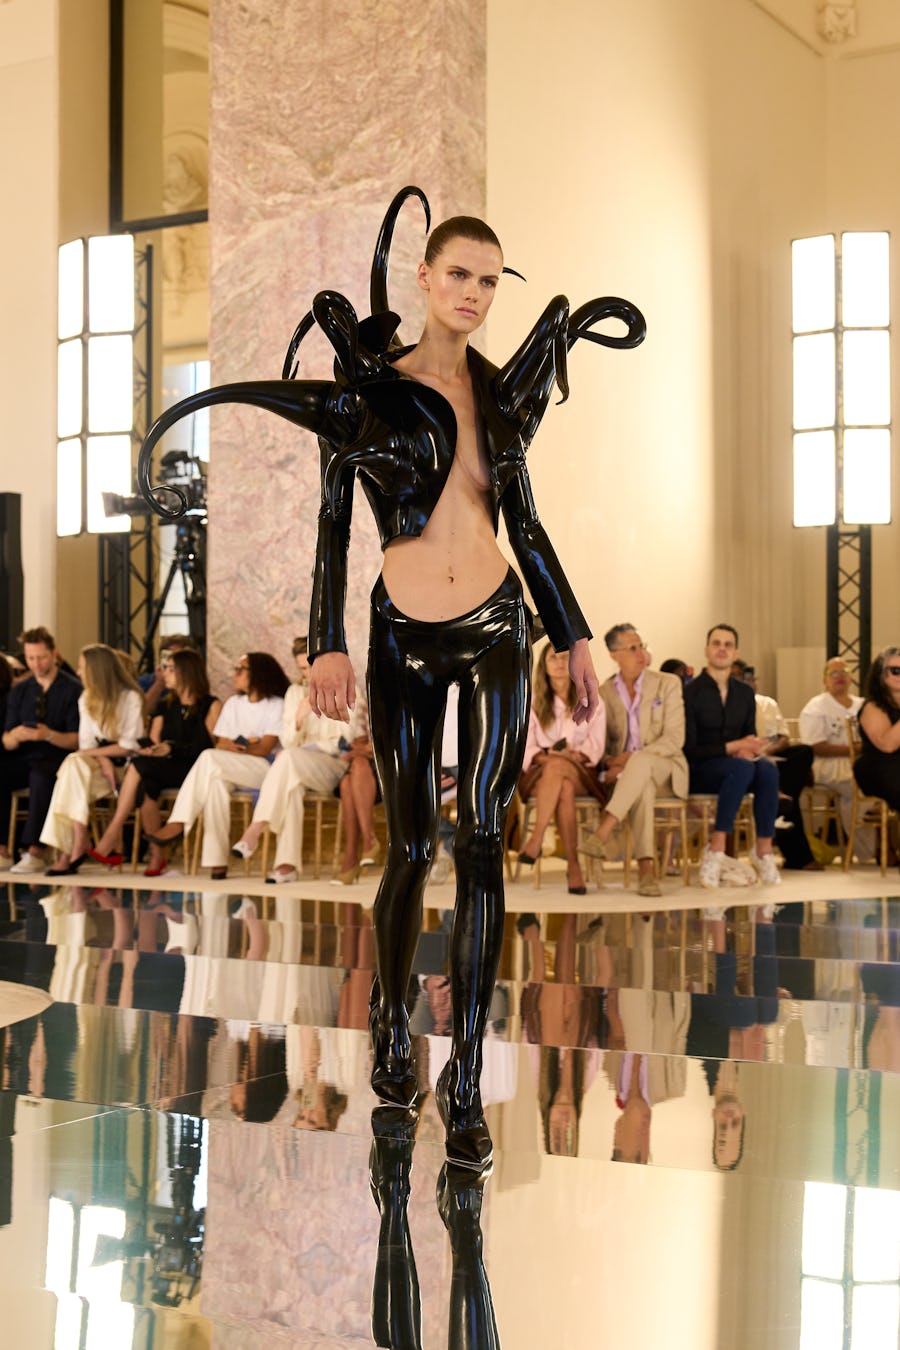
high fashion for graphics tools
Runway PL
Jean Yang asks what happens when programming-language ideas get the same public design culture that fashion has.
I want that for scientific figures: couture-level structure, made available for everyday chart decisions.
Jean Yang, “Runway PL” and Fast Fashion · Schiaparelli FW 2026-27
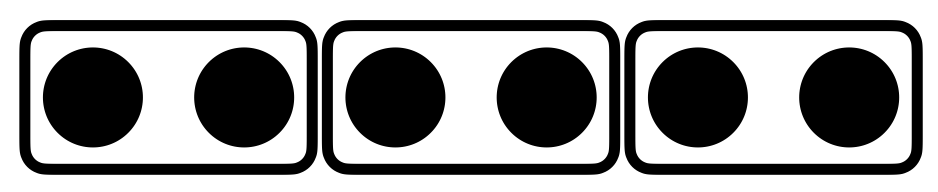
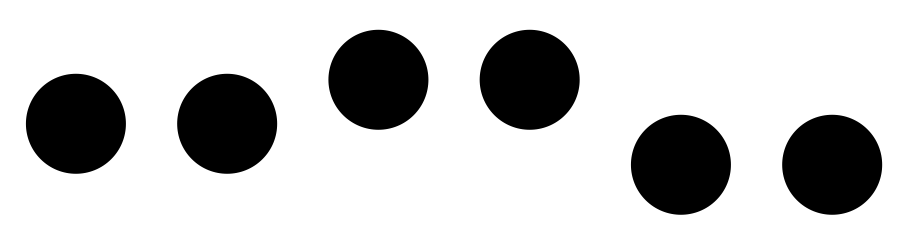
GoFish is based on Gestalt grouping principles
| containment |
|
| connection |

|
| similar attribute |

|
| alignment |
|
| proximity / uniform density |

|
| containment |
|
| connection |
|
| similar attribute |
|
| alignment |
|
| proximity / uniform density |
|
back to those bar charts
start with the data shape
GoFish walkthrough
chart(barley)
  .flow(
  )
  .mark(
  )
start with the data
chart(barley)
| variety | site | year | yield |
|---|---|---|---|
| Manchuria | University Farm | 1931 | 27.00 |
| Manchuria | Waseca | 1931 | 48.87 |
| Manchuria | Morris | 1931 | 27.43 |
| … | … | … | … |
nesting order changes the question
site → variety
What are the trends across sites?
spread(by="site", dir="x")
spread(by="variety", dir="x")
variety → site
What is the most productive site for each variety?
spread(by="variety", dir="x")
spread(by="site", dir="x")
is it one variety, or all of them?
flattening the hierarchy
chart(data).flow(
  spread(by="lake", dir="x"),
  stack(by="species", dir="y", size="count"),
).mark(rect(fill="species"))chart(data).flow(
table(by=("lake", "species")),
).mark(rect(fill="count"))sort() on the stack
chart(barley)
  .flow(
    spread(by="variety", dir="x", spacing=24),
    spread(by="year", dir="x", spacing=4),
    stack(by=field("site").sort("yield"), dir="y", size="yield")
  )
  .mark(
    rect(fill="site")
  )
sort each stack
chart(barley)
  .flow(
    spread(by="variety", dir="x"),
    spread(by="year", dir="x"),
    stack(by=field("site").sort("yield"), dir="y", size="yield")
  )
  .mark(
    rect(w=8, fill="site")
  )
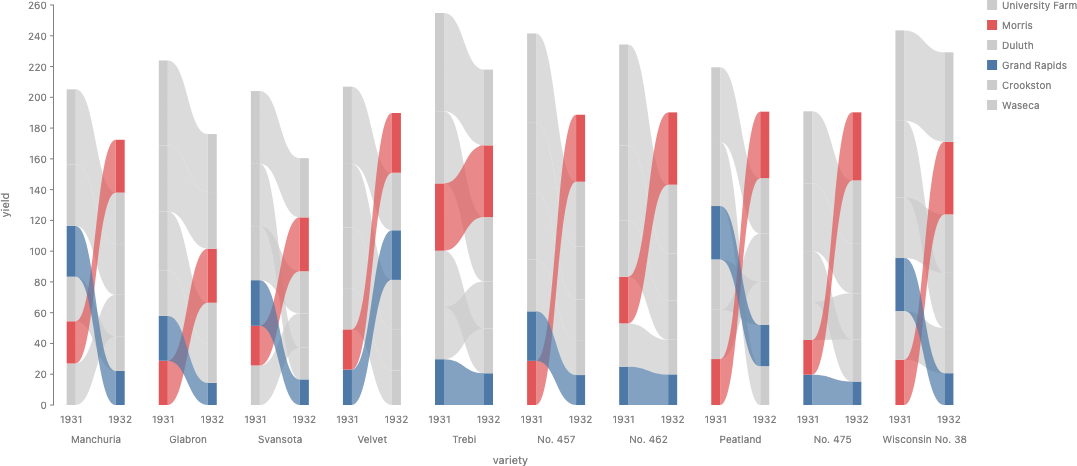
connect related bars
layer([
  chart(barley)
    .flow(
      spread(by="variety", dir="x", spacing=24),
      spread(by="year", dir="x", spacing=16),
      stack(by=field("site").sort("yield"), dir="y", size="yield")
    )
    .mark(rect(w=8, fill="site").name("bars")),
  chart(selectAll("bars"))
    .flow(group(by="variety"), group(by="site"))
    .mark(ribbon(opacity=0.5))
])
style is downstream of structure
layer([
  chart(barley, color=palette({
    "Waseca": "#d7dadd", "Morris": "#49a66a",
    "Grand Rapids": "#d7dadd",
    "Crookston": "#d7dadd", "Duluth": "#d7dadd",
  }))
    .flow(
      spread(by="variety", dir="x", spacing=38),
      spread(by="year", dir="x", spacing=8),
      stack(by=field("site").sort("yield"), dir="y", size="yield")
    )
    .mark(rect(w=16, fill="site").name("bars")),
  chart(selectAll("bars"))
    .flow(group(by="variety"), group(by="site"))
    .mark(ribbon(opacity=0.78))
])
mapping length to angle changes the afforded queries
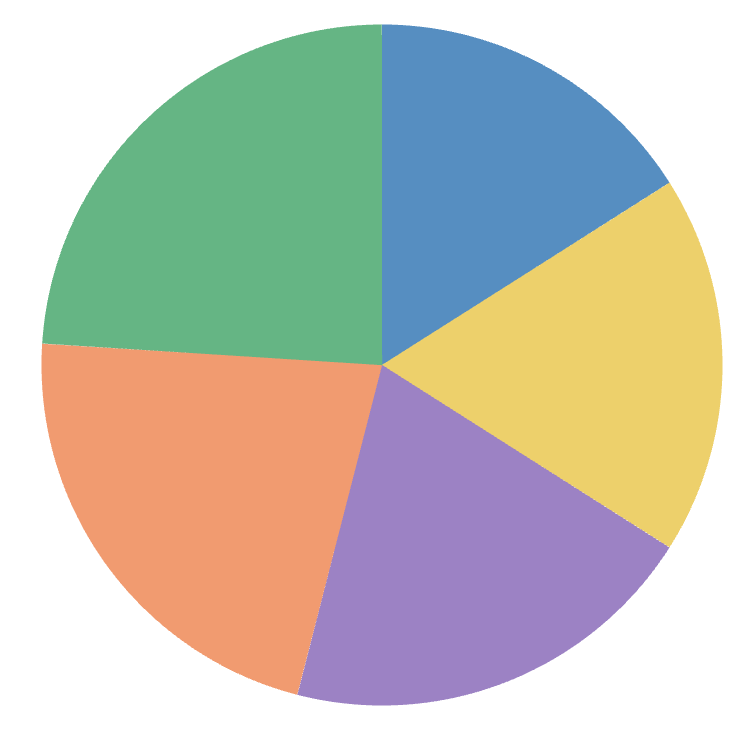
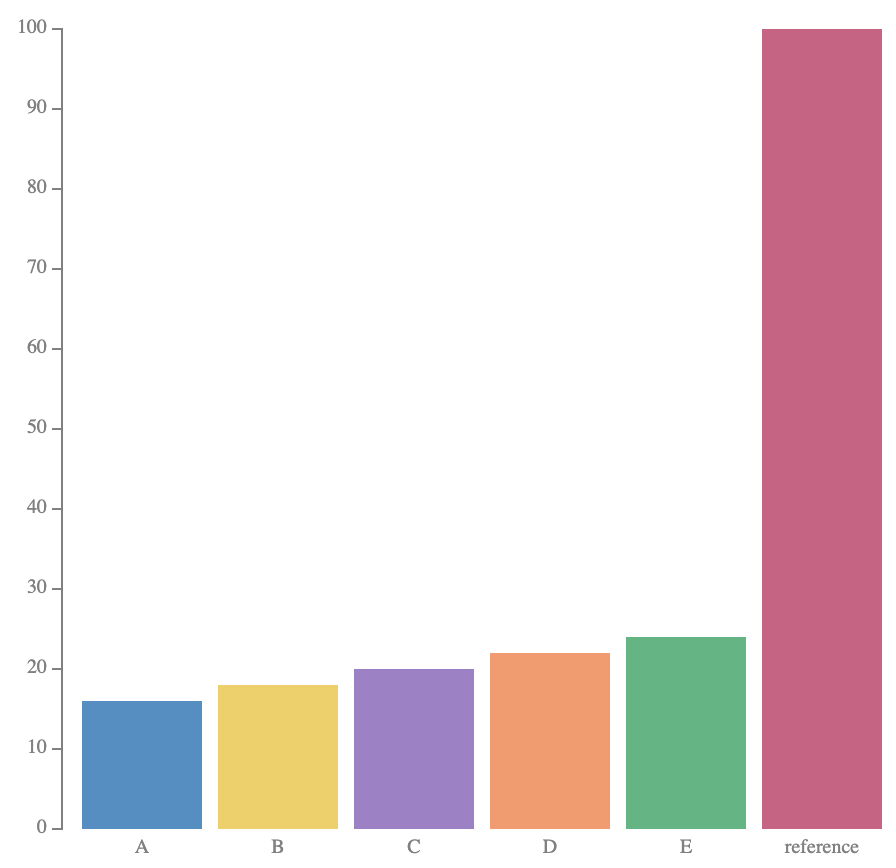
mapping length to angle changes the afforded queries
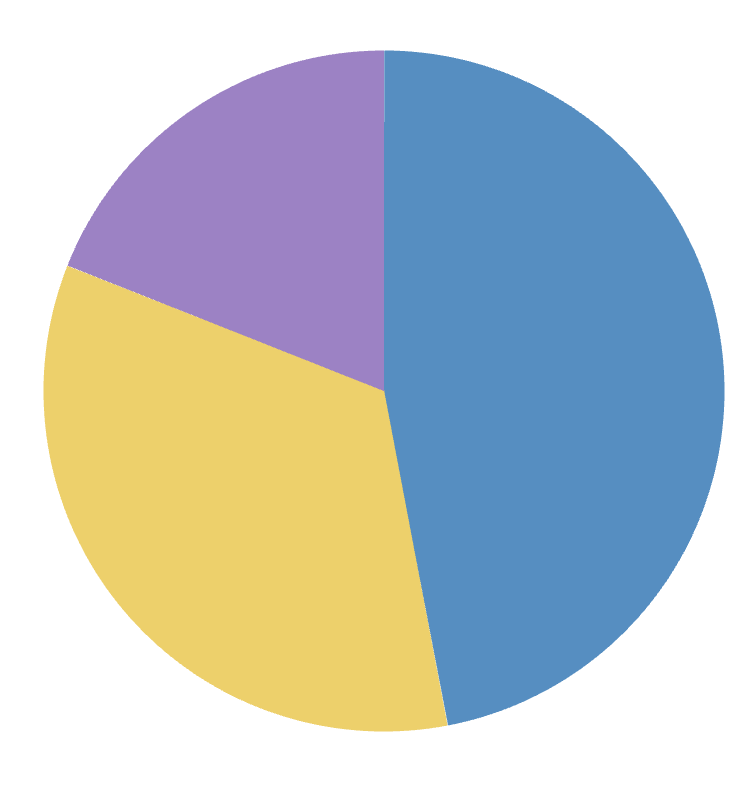
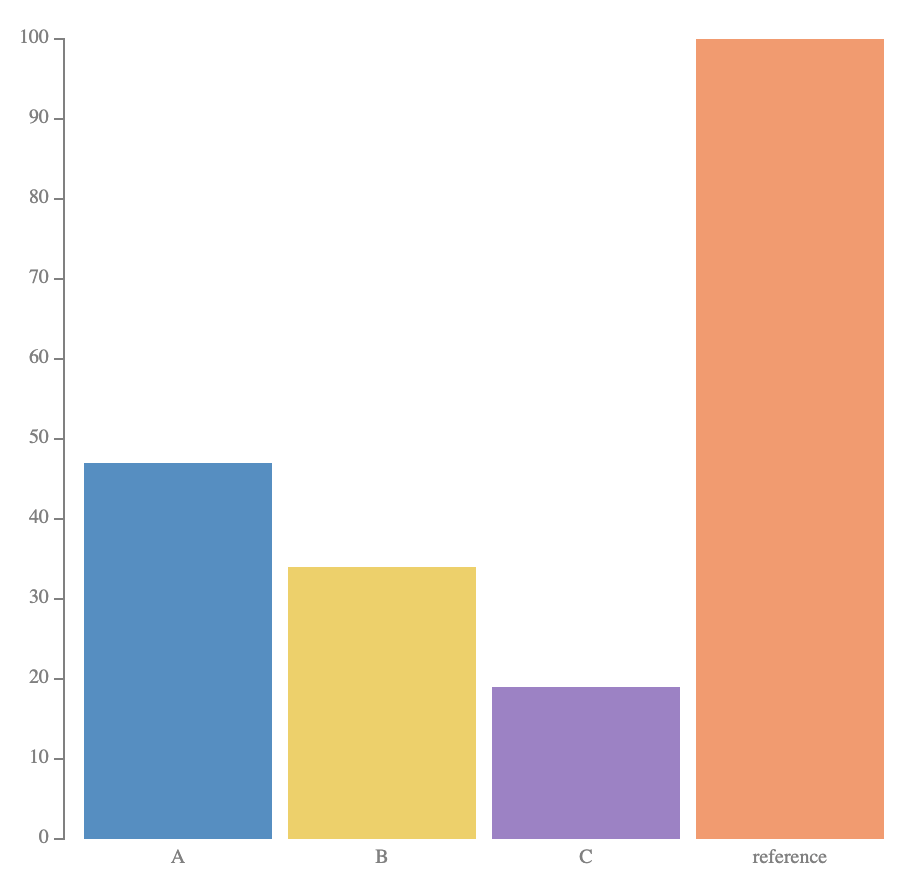
scatter -> pie = scatterpie
chart(scatter_data).flow(
    scatter(by="lake", x="x", y="y")
).mark(
    chart(coord=clock())
    .flow(stack(by="species", dir="x", size="count"))
    .mark(rect(fill="species"))
)
Outer structure:
scatter() affords "where?" queries.
Inner structure: pie affords "what fraction?" queries.
same glyph, new dataset: barley, two years
# x, y: each site's Minnesota lon/lat
def site_pie(data):
    total_yield = total_yield_for(1931, data[0]["site"])
    return (
        chart(data[0]["collection"], coord=clock())
        .flow(stack(by="variety", dir="x", h=pie_radius(total_yield), size="yield"))
        .mark(rect(fill="variety"))
    )

chart(barley_scatter_by_year(1931)).flow(
    scatter(by="site", x="x", y="y")
).mark(site_pie)
Same construction as the lake scatter-pie: each trial site sits at its real Minnesota location, and each glyph is a pie of that site's variety mix.
New move: pie radius (h)
scales with each site's total yield that year, on
a shared scale across both charts.
1931
1932
first, just the points
chart(barley)
  .flow(
    spread(by="site", dir="x"),
    spread(by="year", dir="x"),
    scatter(by="variety", y="yield")
  )
  .mark(circle(r=3, fill="variety"))
connect the points with lines
chart(barley)
  .flow(
    spread(by="site", dir="x"),
    spread(by="year", dir="x"),
    scatter(by="variety", y="yield"),
  )
  .mark(line(by="variety", along="year", fill="variety"))
for change, position beats angle
Slope gives direction immediately. But comparing how much each variety changed means comparing line angles.
Delta bars put every signed change against the same zero baseline. We give up the two absolute yields and the explicit trajectory.
simplify your message
chart(barley)
  .flow(
    spread(by="site", dir="x"),
    spread(by="year", dir="x"),
    scatter(by="variety", y="yield"),
  )
  .mark(line(stroke="variety"))
anchor the comparison
chart(barley) .flow( derive(anchor_to_1931), spread(by="site", dir="x"), spread(by="year", dir="x"), scatter(by="variety", y="delta_from_1931"), ) .mark(line(stroke="variety"))
trade angle for position
chart(barley) .flow( spread(by="site", dir="x"), spread(by="variety", dir="x"), derive(lambda rows: [{ **rows[0], "delta": rows[1]["yield"] - rows[0]["yield"] }]), ) .mark(rect(h="delta"))
the line has nothing left to connect
chart(barley) .flow( derive(delta), spread(by="site", dir="x"), scatter(by="variety", y="delta"), ) .mark(circle(r=4))
use color for emphasis
chart(barley, color=palette({"Morris": "#e08214"}))
  .flow(
    spread(by="site", dir="x"),
    spread(by="variety", dir="x"),
    derive(lambda rows: [{
      **rows[0], "delta": rows[1]["yield"] - rows[0]["yield"]
    }]),
  )
  .mark(rect(h="delta", fill="site"))
annotations can emphasize your message
chart(barley, color=palette({"Morris": "#e08214"})) .flow( spread(by="site", dir="x") .label( field("site").map({ "Morris": "Only Morris rose across every variety" }), position="outset-top", color="#e08214" ), spread(by="variety", dir="x"), derive(lambda rows: [{ **rows[0], "delta": rows[1]["yield"] - rows[0]["yield"] }]), ) .mark(rect(h="delta", fill="site"))
What just happened?
We took one dataset and made a series of deliberate structural moves.
Each move changed what was easy or hard to see.
We didn't have to pick from a menu of charts... though those are useful shorthands for common structures!
Instead, chart type labels like bar or pie were just structural motifs we encountered along the way.
choose by the structure you need
| What you want to see | Operator | Visual structure |
|---|---|---|
| compare the same measure across discrete groups | spread(by=key) |
|
| see how parts add up to a whole | stack(by=key, size=value) |
|
| see how two measures vary together | scatter(by=key, x=x, y=y) |
|
| follow the same item across positions |
line(by=key) or
ribbon(by=key)
|
|
| look up a value by two discrete keys | table(by=(row, col)) |
Beyond layout: data transforms change the values, color changes grouping and emphasis, and coordinate transforms change the geometry.
each operator makes one query cheap
| Operator | shape |
index
what by= builds
|
ask the queries it makes cheap |
|---|---|---|---|
spread(by=key)
|
1 axis · discrete
|
key → its own slot, side by side
|
look up ⟨an entity⟩ at its key
compare ⟨summaries⟩ across key
|
stack(by=key, size=value)
|
1 axis · discrete · slots sized by value
|
key → a segment sized by value, tiled end to end in order
|
look up ⟨key's segment⟩ in order
compare ⟨sizes⟩ across key
read ⟨the total = Σ size⟩ at the far edge
|
scatter(by=key, x=x, y=y)
|
1–2 axes · continuous
|
key → a point at (x, y)
|
look up ⟨an entity⟩ at (x, y)
collect ⟨the shape of the crowd⟩
|
table(by=(row, col))
|
2 axes · discrete
|
(row, col) → a cell, a grid both ways
|
look up ⟨a value⟩ at (row, col)
compare ⟨…⟩ along a row or a column
|
| relational, draws over an index, builds none | |||
line() / ribbon()
|
no index, draws over one
|
none |
follow ⟨an entity⟩ across scopes
read ⟨crossings⟩ as overtakes
|
beyond standard charts
move 1 of 4 · bars → pies → scatter
shares as stacked bars
the same shares as pies
which species dominates each lake?
beyond standard charts
size → units
the same counts as continuous bars
how many fish, exactly?
continuous bars
chart(seafood)
  .flow(
    spread(by="lake", dir="x"),
    stack(by="species", dir="y", size="count")
  )
  .mark(rect(w=36, fill="species"))
countable units
chart(seafood)
  .flow(
    spread(by="lake", dir="x"),
  )
  .mark(waffle(count="count", fill="species"))
waffle mark
def waffle(count, fill, columns=5):
  return flow(
    repeat(count), chunk(columns),
    spread(dir="y", reverse=True), spread(dir="x"),
  ).mark(rect(w=8, h=8, fill=fill))
beyond standard charts
one more level
did third class fare better than crew?
condition on sex: the answer flips
one level
chart(titanic)
  .flow(
    stack(by="class", dir="y", size=field("count").normalize()),
    stack(by="survived", dir="x", size=field("count").normalize())
  )
  .mark(rect(fill="survived"))
one more level
chart(titanic)
  .flow(
    stack(by="class", dir="y", size=field("count").normalize()),
    stack(by="sex", dir="x", size=field("count").normalize()),
    stack(by="survived", dir="y", size=field("count").normalize())
  )
  .mark(rect(fill="survived"))
beyond standard charts
sort + connect
each year's stack, sorted
the same stacks, connected
which source overtook which?
sort each year's stack
sorted = chart(energyMix)
  .flow(spread(by="year", dir="x"),
    stack(by=field("source").sort("amount"), dir="y"))
  .mark(rect(h="amount", fill="source"))
connect the stacks
area = chart(energyMix)
  .flow(spread(by="year"), stack(by="source"))
  .mark(ribbon(by="source", h="amount", fill="source", opacity=0.8))
sort + connect
chart(energyMix)
  .flow(
    spread(by="year", dir="x"),
    stack(by=field("source").sort("amount"), dir="y")
  )
  .mark(rect(h="amount", fill="source"))
  .layer(ribbon(by="source", opacity=0.5))
UK electricity generation · Our World in Data / Ember
beyond standard charts
pictorial charts
ordinary normalized bars
paint the bars as bottles
layer on labels
normalized bars
chart(bottleData, axes=False)
  .flow(spread(by="category", dir="x", spacing=20))
  .mark(layer([
    rect(h=datum(100), fill="gray"),
    rect(h="amount", fill="green"),
  ]))
paint the bottle
chart(bottleData, axes=False)
  .flow(spread(by="category", dir="x", spacing=20))
  .mark(paint([
    image(href=bottlePng, h=datum(100)),
    rect(h="amount", w=175, fill="green"),
  ], blendMode="color"))
layer on labels
chart(bottleData, axes=False)
  .flow(spread(by="category", dir="x", spacing=20))
  .mark(
    layer([
      paint([
        image(href=bottlePng, h=datum(100)),
        rect(h="amount", w=175, fill="green"),
      ], blendMode="color").name("bottle"),
      rect(h=1, y="amount", fill="gray").name("line"),
      text(text="{amount}%", fill="gray").name("label"),
    ]).constrain(lambda bottle, line, label: [
      Constraint.align([bottle, line], x="start"),
      Constraint.distribute([line, label], dir="y", spacing=0),
      Constraint.align([label, line], x="end"),
    ])
  )
Pictorial composition grammar adapted from PiCCL · Shi et al., IEEE VIS 2025
three stacks make a mosaic
chart(titanic)
  .flow(
    stack(by="class",    dir="y", size=field("count").normalize()),
    stack(by="sex",      dir="x", size=field("count").normalize()),
    stack(by="survived", dir="y", size=field("count").normalize())
  )
  .mark(
    rect(fill="survived")
  )
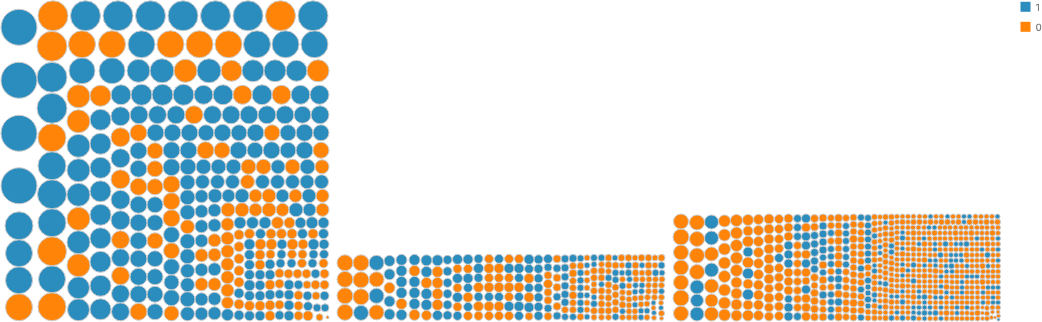
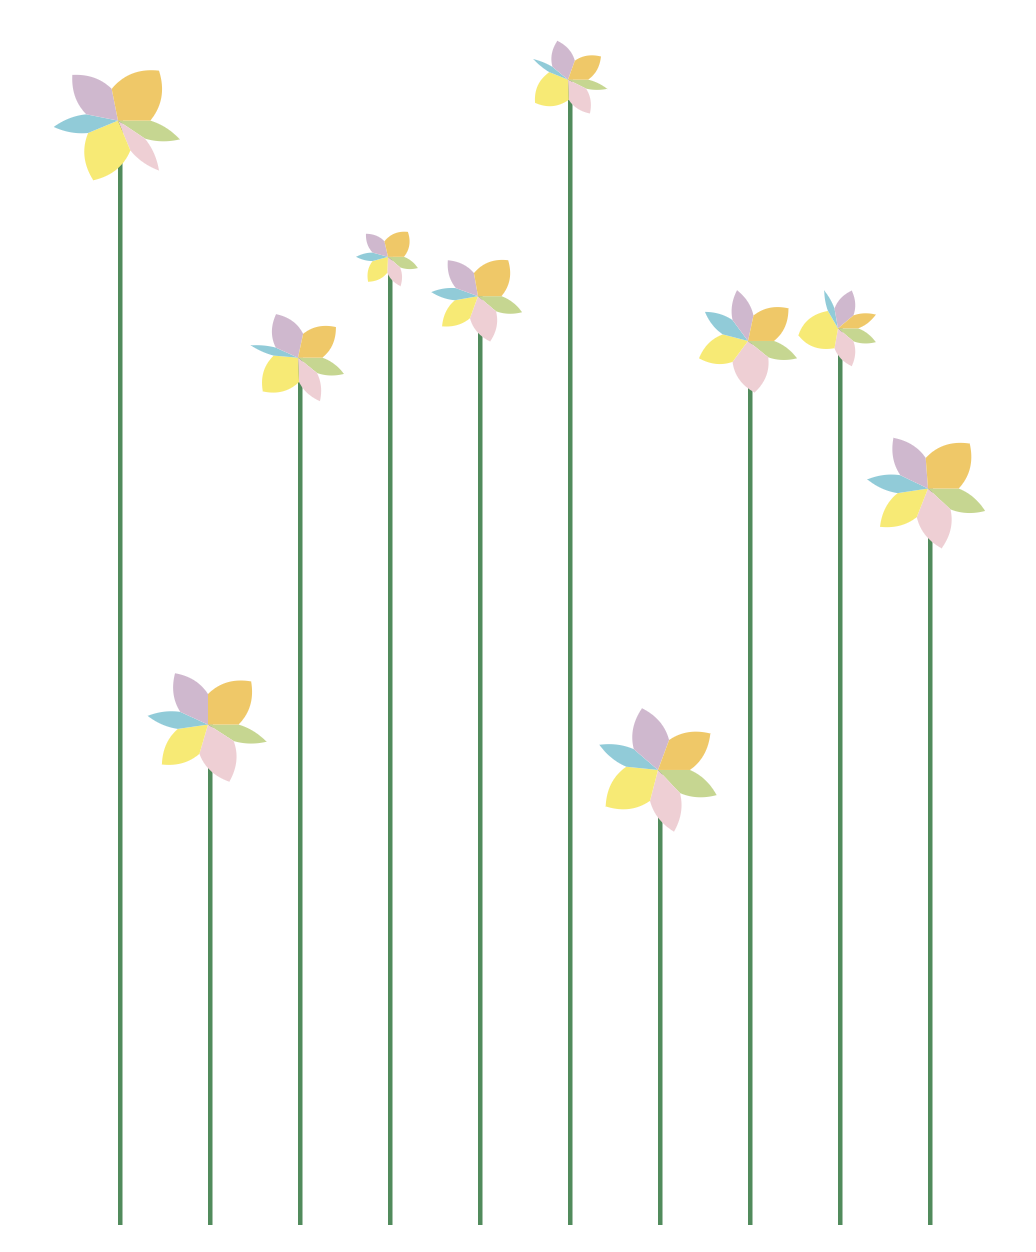
the same moves, stranger structures
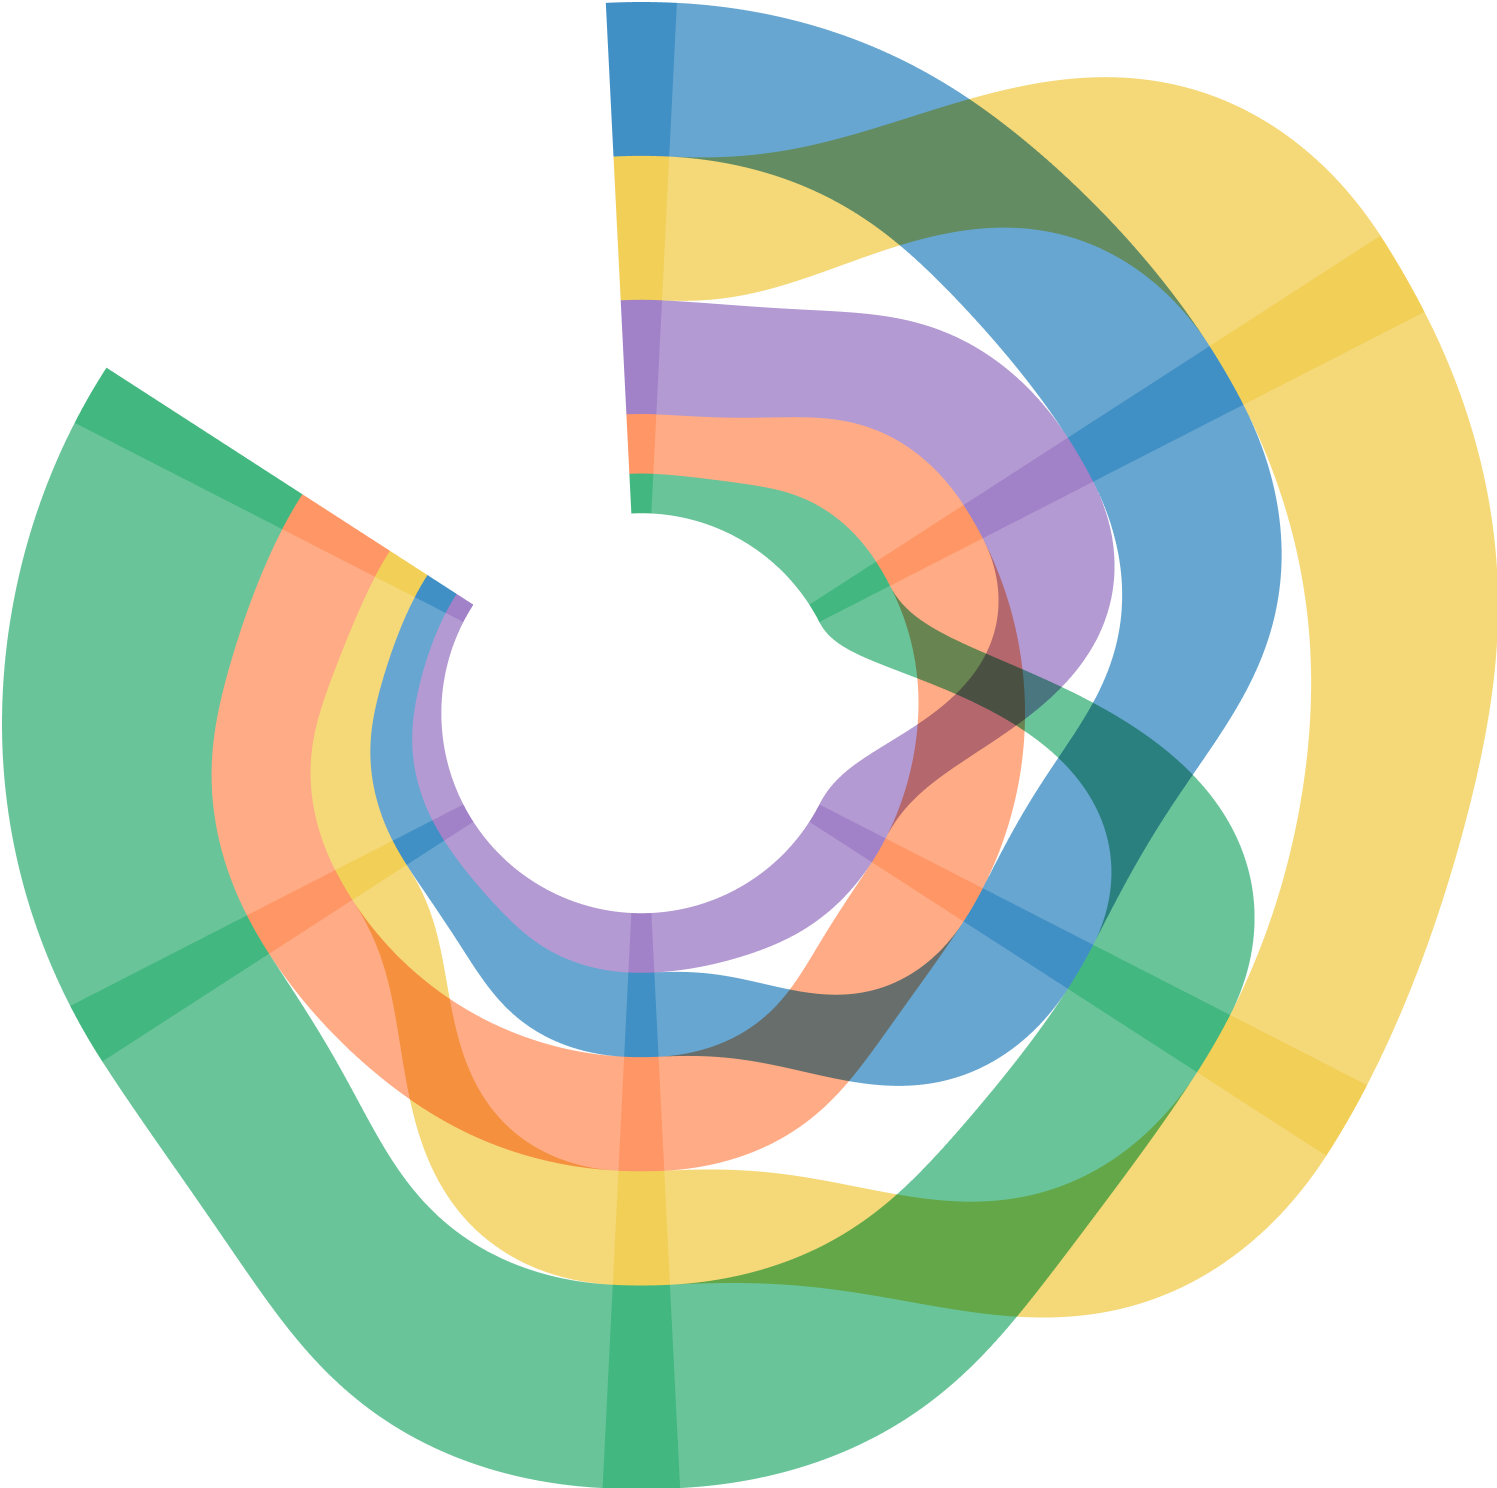
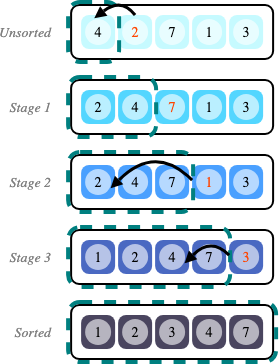
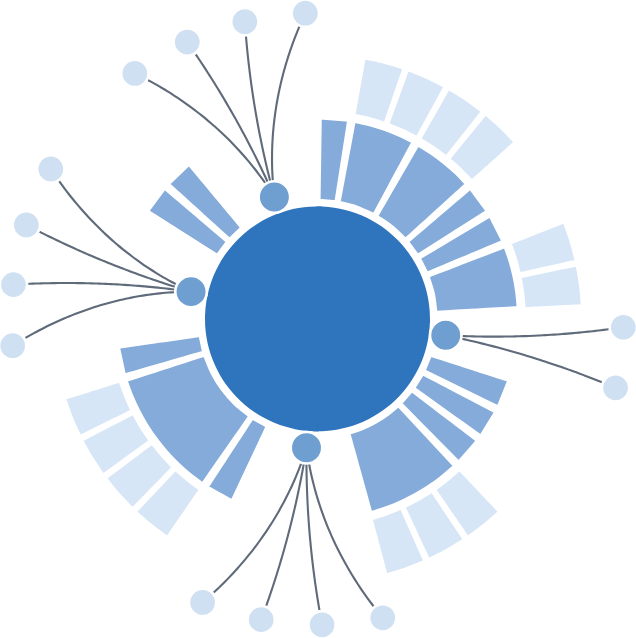
Why "more"
a grammar of more graphics
The Grammar of Graphics fits inside GoFish, and so do grammars beyond it.
GoFish's own test gallery reimplements, example by example:
- vega-lite: the grammar underneath Altair
- Atom: unit & dot-plot charts
- PiCCL: pictorial charts (the bottle)
- GoTree: a tree-layout grammar, 46 gallery examples
- seaborn-style jointplots, and Bluefish diagrams
takeaways
1. Graphics are visual data structures that we query with our eyes.
2. GoFish makes visual structure composable, letting us build familiar charts and continue beyond what conventional visualization grammars make easy.
3. Start with what the reader needs to see, then build the structure that makes it easy.
find me
